Archive for the ‘1’ Category

The 6th July 2014 storm… and radioactivity peak.

July 7, 2014

See new additions at the end of the text!

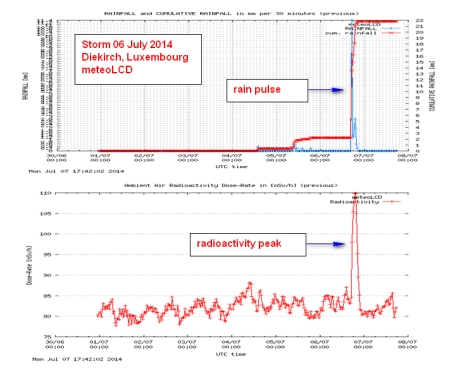
Some parts of Luxembourg were under a severe storm during the late afternoon of the 6th July 2014. Wind gusts were very high (we measured a half-hour maximum of 15 m/s (54 km/h, i.e. a maximum of the average over 30 minutes) which is considerable for a location at the bottom of a valley. Our backup Vantage Pro station measured a high wind maximum of 25 m/s (90 km/h, this is an instantaneous maximum, not an average over some time interval), so no wonder that quite a lot of trees went down or lost branches. The atmospheric pressure dip (average over 30 minutes) was not spectacular: about -4 hPa (mbar),  but this seems sufficient to cause very strong winds. Our lightning sensor was down, which is a pity, for we missed to  record a nice storm activity. Precipitation (rainfall) peaked at about 20 mm in half an hour, and the corresponding atmospheric radioactivity surge due to radon washout was  27 nSv/h.

rad_and_rain_06Jul14

So lets go back to our previous discussions of radon washout (here and here) and update the graph relating radioactivity peak to precipitation pulse.

radon_washout_06Jul14

A linear fit forced through the origin is impossible: R2 = 0 ! The affine fit Rad_peak = a + b* Rain_pulse gives a slope of 0.45, i.e. every mm of precipitation pulse would increase ambient radioactivity dose-intensity through radon washout by 0.45 nSv/h. This very low value (to be compared to 7 given in the previous discussion) points to sort of a saturation effect. Let use imagine that a rain pulse of infinite intensity (hm!) would washout all radioactive radon daughters contained in a surrounding volume (a column of a certain height and a certain diameter for instance). Then a better model would be a logarithmic one,  something like radon-peak = a*log(b*rain-pulse) +c, where log is the natural logarithm ( a still better model would have a horizontal asymptote). This gives indeed a better picture with a GOF of R2 = 0.29.:

radon_washout_06Jul14_logmodel

In this discussion, only measurements were there is an interval of at least 3 days between the rain-pulse have been retained. The 8 Sep 2013 data point seems rather odd: may be it is the outlier spoiling a nice model!

Let’s close with a very simple model using a rational function, which has a horizontal asymptote but will not be forced through the origin:

radon_washout_06Jul14_rationalmodelHurrah: the goodness of the fit now jumps to R2 = 0.33. If the rain_pulse x tends to infinity, the rad_peak will reach the asymptotic value of 30.26 nSv/h. When the rain_pulse is zero, we should expect a radon-peak being also zero: we are close with 1.1 nSv/h.

Time to leave the playground, but this amusing topic will be continued…

__________________________

Additional comments (08 July 2014):

Patrick Breuskin from the Division de la  Radioprotection and  a meteoLCD collaborator from time to time sent me his measurements made at 3 different locations by an AGS421 gamma counter (sampling interval = 10 minutes): AGS421_7235 is installed on the deck of meteoLCD, AGS421_7288 at the Findel airport and AGS421_7199 is measuring at Esch-Alzette. I annotated his graphs, which are shown here in the same order:

20140706AGS7235StormRain_annotated 20140706AGS7288StormRain_annotated20140706AGS0199StormRai_annotated

Obviously all instruments show a radiation peak coincident with the precipitation pulse. Expressed as percentages above the previous background levels, the radiation peaks are:

Diekirch meteoLCD:  33 %               (baclground 83 nSv/h)

Diekirch AGS421     :  47% (54%)    (background 83 nSv/h)

Findel airport:             83%               (background  113 nSv/h)

Esch-Alzette:               37%                (baclground  132 nSv/h)

The two Diekirch and Esch-Alzette peaks are relatively close. As the meteoLCD reading is an average over 30 minutes, one should expect lower values than the 10-minutes sampled AGS421_7235 located on the same deck. The high value of 83% at Findel airport is a bit of a surprise: as this airport is located at about 360m asl, and much more exposed to wind than the other stations. Could it be that higher wind-speeds push the radiation peaks up?

Here are the wind speed peaks rounded to the nearest integer:

Diekirch meteoLCD:  15 m/s

Findel airport:             13 m/s

Esch-Alzette:     not available

These wind velocities are comparable, so wind speed does not seem to influence the relative radiation peak; neither does the background level which is highest at Esch-Alzette without yielding a higher relative radiation peak. Possibly the level of the precipitation pulse is the main factor contributing to the intensity of the radon washout. The Findel measurements are not yet available, and the closest station from ASTA is that of Merl which shows only 14.2 mm.

Well you know the tune “We need more data!”, so lets be patient.
 

Radon washout (2)

April 26, 2014

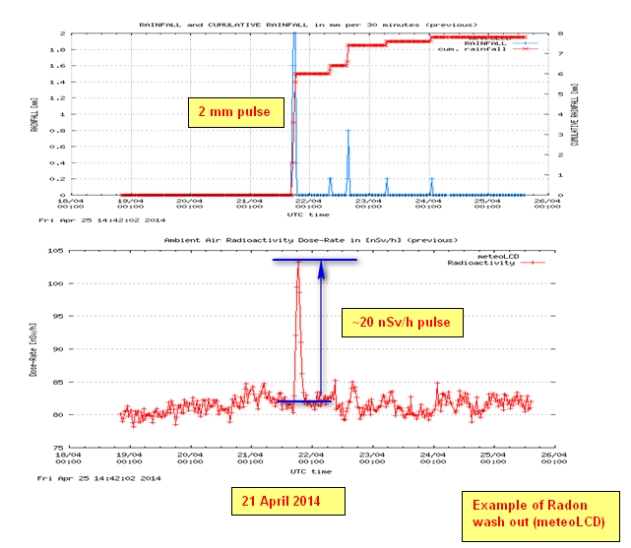
In August 2013 I wrote a small comment  on ambient air radioactivity peaks coincident with a sharp rain fall pulse. Several specialists like A. Kies and M. Severijnen confirmed that these observations show a wash out of the radioactive daughters of the ubiquitous radon gas. This year a similar event happened the 21th April 2014:

Image

Note that the 2 mm rain fall pulse triggered a radiation rise of about 20 nSv/h above the base level. One also sees that the much lower rain fall pulse (0.8 mm) which happened the next day does only a minor radiation peak.

Several interesting questions can be asked:

1. Is there a minimum time between two rain fall pulses needed to cause strong radiation peaks?

Or in other words: how long does it take for the atmosphere aerosol content to recover after a first washout?

The observations made in August 2013 suggest that 1 day could be enough:

Image

The first rain pulse (1.2 mm) causes a radiation peak of about 14 nSv/h; the second much stronger rain pulse (2.2 mm) triggers a radiation peak of comparable amplitude: this could be a hint that the atmospheric aerosol load has not quite recovered to the previous level (which would be the base line after 3 dry days).

A week in September 2013 gives a similar picture:

Image

Here we see two strong similar rain pulses of about 4 mm separated by about 48 hours: the first triggers a radiation peak of about 35 nSv/h. and the second of only 15 nSv/h. A close inspection shows that this second rain pulse actually is double, a first of 2.8 mm followed a couple of hours by a second of 4 mm. The radiation curve peak also shows these two peaks, with again the second (corresponding to a higher rain fall) less than the first.
The conclusion is that a simple relation-ship of the form radiation-peak = f(rain pulse) can not be established without respecting this atmospheric recovery time lapse.

2. Is the radiation peak proportional to the rain fall pulse?

Using only our miniscule set of observations from 2013 and 2014, let us just keep the (rain pulse, radiation peak) points separated by a minimum of 3 dry days:

Image

The plot shows that the slope of the regression line is 7.09. i.e. the first rain-fall pulse of 1 mm causes on average a radiation peak of 7 nSv/h. The goodness of the fit is rather poor (R2 = 0.28), and this analysis shouts for more data!


Conclusion:

An analysis of the relationship between rain pulse and radiation peak intensities must respect the time lapse needed for the recovery of atmospheric aerosol load, possibly 3 dry consecutive days . This first short study suggests a possible linear relationship with a slope of 7 (nSV/h)/mm .

The Resilient Earth

August 7, 2010

I bought this book published in 2008 ten months ago, and found only now the time to read it. The authors are not climatologists, but scientists specializing in computer systems (Allen Simmons) and mathematics as well (Dough L. Hoffman). Both participated in cutting edge projects, as computers systems for the TIROS satellite or molecular dynamics simulations. The 400 page book starts with a big chunk ( ~200 pages) of the past:  climate changes of the past, ice ages, moving continents, astronomical changes etc. This part is well and clearly written. A very interesting chapter is on experimental data and error and on the limits of climate science. Than follows a discussion of the prophets of doom, and about the worst that can happen (according to the authors:  probably nothing to lose your head). They conclude on mitigation strategies and on a plan for the future.

The authors clearly are not impressed by the IPCC consensus, neither by the hysterical and politically motivated cries of environmental activists or politicians riding the band-wagon. Nevertheless they worry about our future, and present very sensible guidelines:

– use renewable energy here economically viable
– build energy efficient homes
– overhaul the power grid
– rapidly expand nuclear power

This last recommendation makes European green activists howl, even if more and more scientists with a green agenda espouse it (think of Lovelock, Mc. Kain, …).

The book holds a very complete reference section, with 517 clearly documented items.There are a couple of minor editorial glitches, and all figures are in gray-scale. Clearly color would have been better, at least for multi-curve graphs.
I recommend the book!

Moist Enthalpy

July 22, 2010

Moist enthalpy is the energy stored in 1 kg of moist air; many scientists (like Prof. Roger Pielke, from Colorado State University) think that moist enthalpy is a way better measure to quantify climate warming thant the simple air temperature. I wrote a short article on how to compute moist enthalpy H from dry temperature, relative humidity and air pressure; this was published as a guest post on Prof. Pielke’s blog “Climate Science”. (pdf version here)

I added to the near-live graphs 2 graphs of the variation of that moist enthalpy in Diekirch; this was not too difficult to do,  as GNUPLOT is such a wonderful tool. The following figure shows the 7 days graph, with comments added:

Coming Climate Crisis?

July 11, 2010

I am reaching the end reading this very unusual but highly interesting book. The author Claire L. Parkinson is a researcher (ex-researcher?) at Nasa’s Goddard Space Flight Center, specializing in sea-ice problems. She is an IPCC co-author and certainly can not be labeled a “skeptic”. Calling her “alarmist” also would be wrong. She very strongly defends the skeptics rights and raison d’être, even if she does not agree with many of their opinions.

Her (may be muted, but nevertheless very outspoken) sympathy for skeptical minds is “rewarded” by a rather strange foreword of Prof.  Lonnie G. Thomson, who dissociates herself from the author’s too liberal (= consensus critical) penchant.
It is a big book of ca. 300 pages, covering a very broad range of subjects. The author starts by a large part relating the evolution of earth’s climate and it’s often abrupt changes. There is nothing new here, but the presentation is very readable. I especially liked her chapter on the skeptics (like Lindzen, Singer, Spencer) and on the problems of climate modeling. She deplores the rough handling most skeptics get by the mainstream scientists (comfortably nested in their cosy consensus club);  she also gets angry when these people are declared stooges of the oil industry, revealing that  mainstream scientists can get (and get) whatever funding from these industries without anybody of the consensus crew taking concern.
Her chapter on the problems and pitfalls of modelling is extremely interesting to read, as she begins by a personal experience (modeling polnyas) which showed how hasty conclusions from models can be way out of the mark. She also deplores the rushing into print of partial research results, which often are again faulted a couple of months later.

The book was intended as a warning not to embark in grandiose geo-engineering projects, as there are so many lessons of the past showing how awfully wrong such schemes may go. These warnings, with illustrative examples, are talked about up and again, but I appreciate that they only make a small part of this book.
I am not in line with everything the author writes or thinks; but this book is such a refreshing and surprising venture coming from a community were liberal minds are not always welcome. To be recommended!

The Real Global Warming Disaster

July 9, 2010

Some times ago I read with great pleasure the book “Scared to Death” written by R. North an C. Booker; in this book a lot of scares were studied, and Global Warming was just one among many. Now Booker, who is a regular contributor to “The Sunday Telegraph” concentrates on the big climate scare. He writes a very agreeable English, with polished sentences, and makes reading the  book (368 pages) a delight. The book is a chronology starting in 1972 and stopping just before the Climategate scandal. But even if this latter is missing, it makes exciting reading. I especially admire Booker when he tells us how blindly, puerile and naive politicians and enviro-groups embark on grandiose “green energy” schemes; they are incapable to make a simple computation showing that these schemes are impossible to realize in the proposed magnitude and short time spans (wind energy in the UK is a prime candidate).

Every chapter closes by very extensive references.

I think the book was somewhat rushed into print, as there are a couple of silly blunders (example:  misspelling of Prof. Lindzen name) that a more thorough second reading would have checked. Nevertheless I heartily recommend this book, which takes you for  a thrilling ride through the labyrinth of politicized climatology.

The Great Global Warming Blunder

June 23, 2010

This is an interesting book from Dr. Roy Spencer, whose blog I visit nearly daily.
The book is focused on one single subject: what is the real relation-ship between climate forcing and global temperature response. I.e. if dF = lambda*dT (where F = forcing in Wm-2 and dT = temperature increase cause by dF in Celsius or Kelvin) what is lambda?

This question assumes that the relationship between forcing and temperature is linear; this is the current IPCC consensus, and R. Spencer does not oppose it. He calls the parameter lambda the “global feedback parameter”; others (like Lindzen and Chu use a different notation: they replace lambda by lambda/(1-f) where f is the sum of the feedback parameters). Be it as it is,  for Spencer the slope of the graph of dF versus dT is the dominant parameter pointing to a positive or negative feedback. The imbalance in forcing dF is measured since a couple of years by satellite (CERES), and for dT he says it will be best to use SST (sea surface temperature).
Without going into the details, his conclusion is simple: warming creates water vapour, water vapour creates clouds, clouds in a general have a cooling effect: the whole atmospheric system uses clouds  as a self-stabilizing negative feedback. This is not the IPCC consensus, where increasing water vapour (a potent greenhouse gas) is seen as a positive feedback, increasing a small warming of 1.5°C caused by rising CO2 levels at least to a double value of 3°C.

The book is easy to read, but I have one complaint. R. Spencer tried to avoid any formula and mathematics; this is a pity. I would have preferred (at least in the addendum) a more rigorous mathematical/physical explanation. What comes as a surprise is that his very simple model: dT/dt = [F – lambda*dT]/Cp  can explain (using a plausible time-lag and an assumption on the thickness of the ocean layer warmed up) most of the last century global temperature variations. It seems that the natural oscillations (like PDO and AMO) causing cloud cover changes play a much bigger role than increasing levels of CO2.

I suggest to read this book, but to read also the paper of Lindzen and Chu.

Scafetta’s new paper on celestial climate drivers

June 6, 2010

Dr. Nicola Scafetta from Duke University has written a new important paper (preprint here, not available anymore from arxiv) analyzing the influence of short ( < 100year) celestial periodic drivers on the observed climate changes.  Prominent is the famous 60 years period, that does not appear in the IPCC models, but is well-known as a for instance a feature of the PDO (and that seems present in ancient Chinese and other calendars as well!).
This paper will make splashes among the alarmists, as Dr. Scafetta does not refrain from strong words: “The significant warming of the Earth predicted by the IPCC [2007] and by other AGWT advocates to occur in the following decades is unlikely. In fact, the above findings clearly suggests that the IPCC has used climate models that greatly overestimate the climate sensitivity to anthropogenic GHG increases. Therefore, the IPCC’s projections for the 21st century are not credible.”

Let’s wait for the realclimate guys demolition work!

Claude Allègre: L’imposture climatique

April 13, 2010

I finished reading this book, that provoked many angry comments and a call for censorship by over 600 French “climatologists” (see preceding blog).
This is not a scientific book on climate change: it is written as an interview of Claude Allègre by journalist Dominique de Montvalon. There are not many figures, and those which exist are more like black/white hand-drawn sketches, and not the usual glossy computer generated stuff. This is by design, to give more an overall impression as some very precise presentations. The book is very easy and agreeable to read, but some questions of the journalist are somehow infantile (e.g. the repeated insistence that climate is such a complex thing).

Allègre speaks straight from the heart, and takes no diplomatic precautions.  James Hansen is called a “fanatic”, and the mafia-like manners of some of the top IPCC authors are clearly described. He also is very outspoken on the  profiteers, and does really not hold Al Gore in high esteem. Nevertheless Allègre is a man who cares for the environment, and he points to the ocean acidification problem. He also warns from the green ideology of negative growth.
Having read the book, I wonder how adult scientists can turn to their minister for help to forbid it… This is clownesque!

I made a short comment at realclimate.org, and here is Gavin Schmidt’s answer:

Francis Massen:

Climatology and IPCC bashing is on the rise, and even if one may deplore unfair personal attacks, it would be too easy to reject all recent critics as being too far away from the real thing (i.e. having allegedly not much published, as Hans von Storch is given as an example). Claude Allègre, a geochemist, former French minister of Education and holder of the 1986 Craaford Price in geochemistry (book in France “L’imposture climatique” (approximate translation: climate swindle). This book is so successful, that more than French 600 “climatologists” are asking their minister for help and censuring. If this non-scientific, very outspoken book makes such a splash, is it that all buyers are imbeciles or uniformed? Or could there well be some truth in both Allègre’s book and in the Der Spiegel article?

[Response: Allègre’s book is garbage – full of basic errors, misrepresentations, and simply made up ‘factoids’. And I doubt that you are really wanting to make and argument that book sales numbers trump scientific truth? I recall that Velikovsky and Erich von Daniken were both very successful…. – gavin]

I am sure Gavin has not read the book, but parrots what he has been told by some French colleague. Let us not forget that Allègre is a scientist, who understands what he speaks about; maybe it is this that pushes so many alarmists (or “carbon centrists”) through the roof.

I suggest, you buy the book and read it… and make your own mind on it.

French climate realists get more press

April 3, 2010

Le Figaro, one of the most read French daily papers, has an interview with Prof. Vincent Courtillot, that would not have been possible some years ago. Let me remember that in France two prominent scientists are the most outspoken skeptics of the IPCC and the AGW climate scare:  Claude Allègre, which is a former professor of geochemistry and a former minister of Education is well-known for his very clear (some say: brutal) rumblings. Vincent Courtillot, a geophysicist and specialist in paleomangetism and director of the “Institut de physique du globe de Paris“, says in short that the IPCC is not the holder of the scientific truth. It should be noted that this interview is in response to a petition by some 400 French “climate scientists” to their minister of Education who complain about the climate skeptics (the text of this petition and Courtillot’s answer can be found here). It is indeed strange that scientists have to ask their minister for help, akin to small children that are unable to defend themselves.
In the same issue of Le Figaro, editorialist Yves Thréard writes with some irony that the politicians have made a serious error by over-dramatizing the climate question (you have to watch French TV news to be inundated by messages on “saving the planet”, reducing CO2 emissions,… usually presented in a larmoyant, remorse loaded whining tone);  he also insist rightfully that current eco-political messages all are negative, with their litany of  mandatory negative development, and that a switch to positive ecology is needed.

So finally, the tide is turning in Europe’s press  too, and climate hysteria seems to become uncool.

PS1 :  Read also this excellent comment (in French):  “Climato-scepticisme: Galilée convoqué devant le Saint-Office?”

PS2, 04 Apr10 : Here is an open letter (in French) from mathematician Benoît Rittaud to the writers of the petition