Many times in the past I have posted on the relationship between the thickness of the ozone column (the TOC measured in the Dobson Unit DU), and the effective UVB irradiance at ground level. We (Mike Zimmer and myself) measure the first with our Microtops instruments, and the latter with our UVB Biometer (in minimal erythemal dose power, unit MED/h, or the derived UV index (UVI, were 1 MED/h corresponds to 25/9 UVI): all weather and solar conditions being the same, a higher TOC means lower UVB (or UVI) intensity. See references [1] to [5] or just type RAF into the SEARCH box on the upper right of the screen to find all previous publications in the blog.
From the 4th to the 10th March 2022 we had very fine weather in Diekirch, with cloudless blue skies:
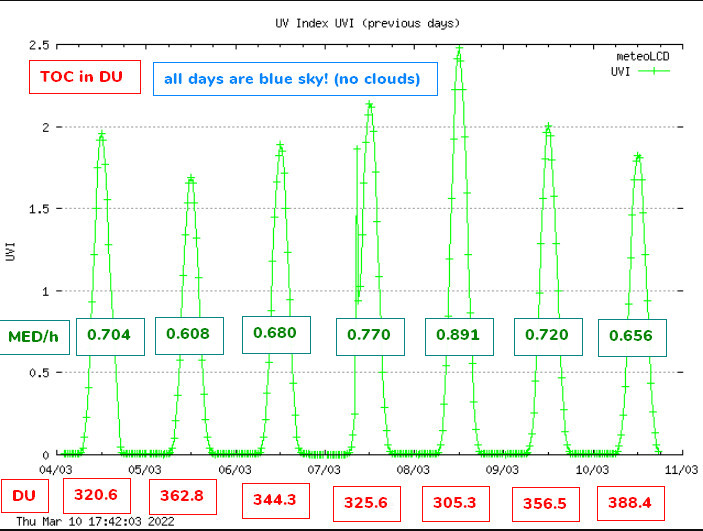
This plot clearly shows that during the 4 days from the 5th to 8th March the UVI ( or the UVBeff given in the green boxes) is increasing, and the TOC given in the red boxes is decreasing; the opposite happens during the next 3 days. The measurements have all been done at nearly the same hour (around 12:00 UTC), the solar position given by the solar zenith angle (SZA) is practically the same (around 55°), and the solar irradiance measured by our pyranometers also varies not much (maximum between 570 and 621 W/m2 on a horizontal surface).
In the next plots I have added the data from the 11th March (same blue sky). First a simple plot of UVI versus TOC:
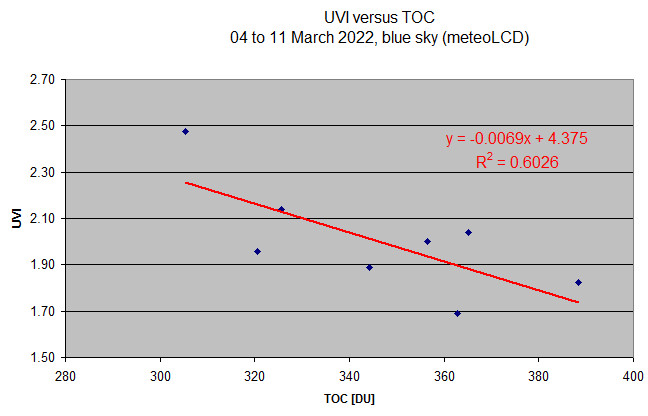
If we take the first and sixth points as a “worst case”, we see that a decline of about 60 DU increases the UVI from 1.70 to 2.50. A simple rule of three to keep in mind would be “100 DU less means 1.3 more UVI”.
This is effectively nothing to be afraid of!
The RAF
The radiation amplification factor is not defined by a linear relationship, but by a logarithmic one; if we plot the negative natural logarithm of UVBeff (= -ln(UBVBeff)) against the natural logarithm of the TOC ( =ln(TOC)), the slope of the trend-line represents the RAF:
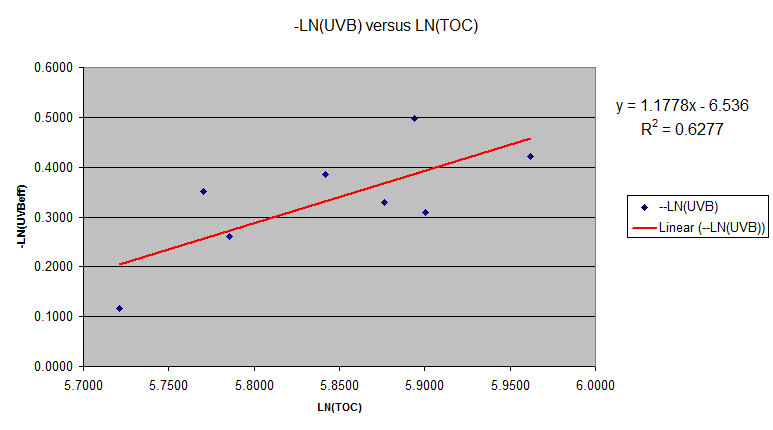
From the equation of the trend-line we see that the slope is 1.178, so the RAF computed from these 8 days is about 1.18
The following table gives all the meteoLCD calculations, and as a comparison the values given by Jay Herman in his paper from 2010 [6]:
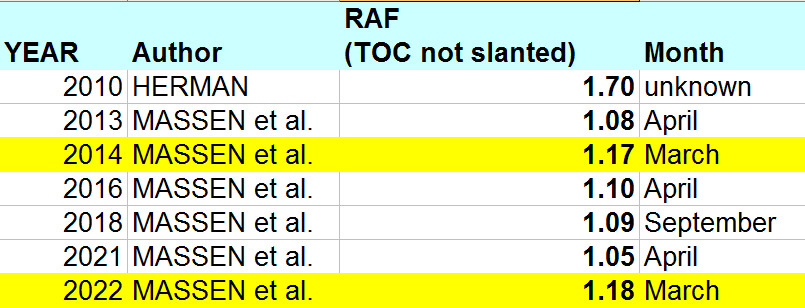
It’s really surprising how close our March values are.
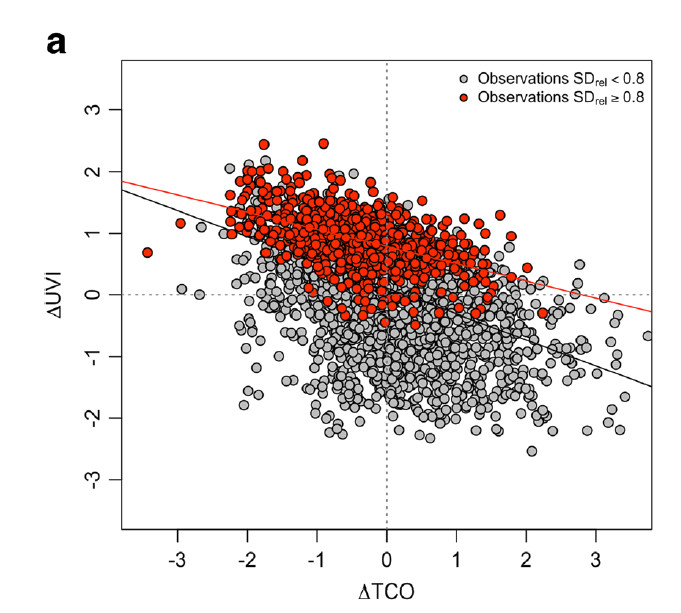
Please read also the interesting paper of Schwarz et al. who use anomaly values for the study of the relationship between TCO and UVI [ref. 7]:
There is some discussion if the TOC readings should be replaced by the TOCslant = TOC/cos(SZA), as the RAF varies with the SZA (see the Herman paper); for these March 2002 readings, this would change the RAF to 1.43.
We will retain the non-slanted TOC in our comparisons (past an future).
References:
[1] MASSEN, Francis: Radiation Amplification Factor in April 2021 (link)
[2] MASSEN, Francis, 2018: UVI and Total Ozone (link)
[3] MASSEN, Francis, 2016: First Radiation Amplification Factor for 2016 (link)
[4] MASSEN, Francis, 2014 : RAF revisited (link)
[5] MASSEN, Francis, 2013: Computing the Radiation Amplification Factor RAF using a sudden
dip in Total Ozone Column measured at Diekirch, Luxembourg (link)
[6] HERMAN, Jay, 2010: Use of an improved radiation amplification factor to estimate
the effect of total ozone changes on action spectrum weighted irradiances and an instrument response function. Journal of Geophysical Research, vol.115, 2010 (link)
[7] Schwarz et al.: Influence of low ozone episodes on erythemal UVB-radiation in Austria. Theor. Appl. Climatol. DOI 10.1007/s007004-017-2170-1 (link)
——————————————-
A small EXCEL file with all March 2022 parameters can be found here.