We had a period of several cloudless, blue sky days at the end of April 2021. So time to redo a calculation of the Radiation Amplification Factor RAF. In short, we want to see how the variation of the Total Ozone Column (TOC) influences the effective UVB radiation at ground level. I wrote several time on this, and usually we found an RAF of approx 1.05 to 1.10.
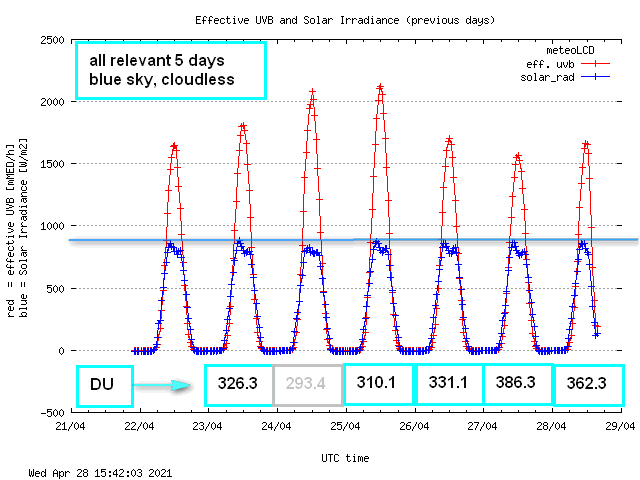
First here a graph showing the variation of total solar irradiance (blue curve, unit W/m2) and the effective UVB (red curve, unit mMED/h):
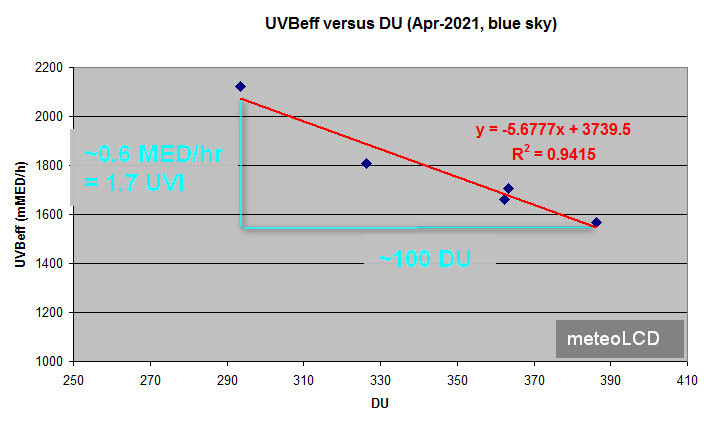
First remark that the peak solar irradiance was practically constant; the 24th April was a bit hazy, so it will be left out in the computations. The numbers in the turquoise boxes are the maximum values of the TOC, measured in DU (Dobson Unit) with our Microtops II instrument (serial 5375). Let us first plot the UVBeff versus the TOC:
Clearly the UVBeff values decrease with increasing TOC, as the thicker ozone column filters out more UVB radiation. The empirical relationship is practically linear, and suggests that a dip of 100 DU (a quite substantial thinning of the ozone layer) would cause an increase of effective UVB of about 0.6 MED/h or 1.7 UVI (as 1 MED/h = 25/9 UVI).
The numerical correct definition of the RAF is : UVB = C * TOC**RAF where ** means “at the power of” Taking the natural logarithm gives ln(UVB) = ln(C) +RAF*ln(TOC) or RAF = [ln(UVB – ln(C)]/ln(TOC).
If we have many measurement couples of UVB and TOC, it can be shown (see here) that
RAF = [-ln(UVBi/UVB0)]/[ln(TOCi/TOC0)]
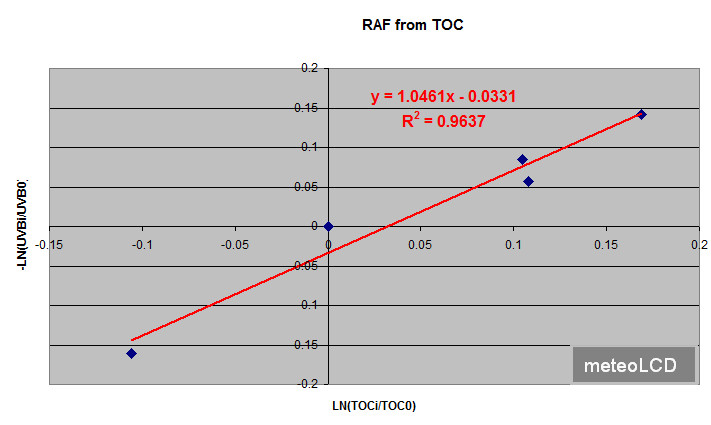
where the index i corresponds to the ith measurement couple, and 0 to that taken as a reference (usually i=0). This is equivalent to say that RAF is the slope of the linear regression line through the scattterplot of -1*ln(UVBi/UVB0) versus ln(TOCi/TOC0).
Here is that plot:
The slope is 1.0461, so the (erythemal) RAF computed from the 5 blue sky days is RAF = 1.0461 ~1.05
This has to be compared to the value RAF = 1.08 in the referenced paper [ref. 1]. Note the excellent R2 = 0.96 of this linear fit.
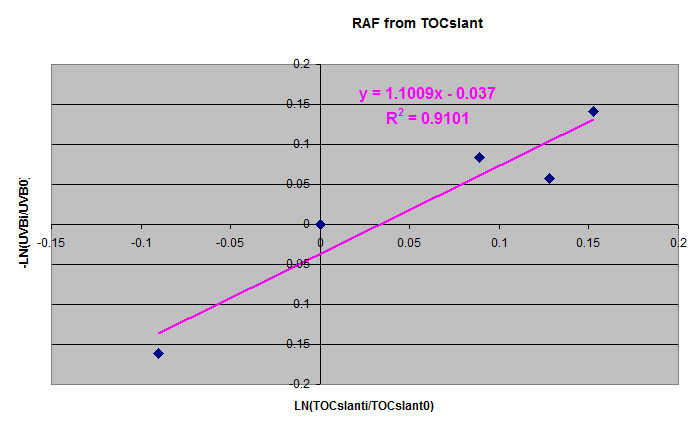
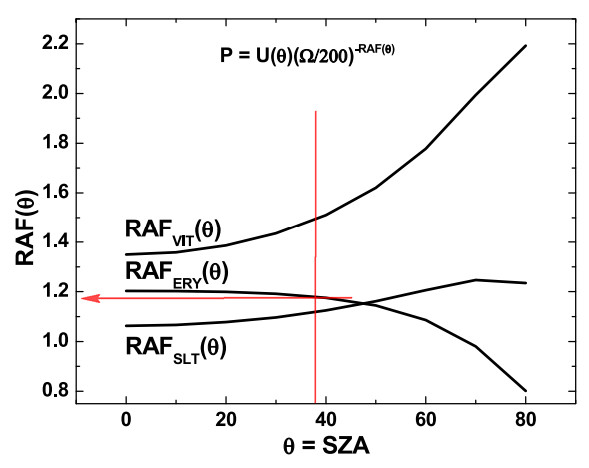
There is some discussion if TOC should be replaced by TOCslant = TOC/cos(SZA), where SZA is the solar zenith angle. If we do this, the RAF ~ 1.10, close to the previous value; the R2 is somewhat lower with R2=0.91. The SZA is practically constant for the 5 days wuth SZA ~38° .
The RAF = 1.10 value is close to what Jay Herman published in GRL in figure 8 [ref. 2] (red lines added):
Conclusion
These 5 days of cloudless sky give practically the same results for RAF as that found during previous investigations. As a very raw rule of thumb one could keep in mind that a dip of 100 DU yields an increase of at most 2 UVI. The following table resumes the findings of this paper and the references 1 to 5:
______________________________________
References:
[1] MASSEN, Francis, 2013: Computing the Radiation Amplification Factor RAF using a sudden
dip in Total Ozone Column measured at Diekirch, Luxembourg (link)
[2] HERMAN, Jay, 2010: Use of an improved radiation amplification factor to estimate
the effect of total ozone changes on action spectrum weighted irradiances and an instrument response function.
Journal of Geophysical Research, vol.115, 2010 (link)
[3] MASSEN, Francis, 2014 : RAF revisited (link)
[4] MASSEN, Francis, 2016: First Radiation Amplification Factor for 2016 (link)
[5] MASSEN, Francis, 2018: UVI and Total Ozone (link)

March 13, 2022 at 10:45 |
[…] [1] MASSEN, Francis: Radiation Amplification Factor in April 2021 (link) […]