Antero Ollila from the Aalto University (Finland) has published in the Journal of Earth Sciences and Geotechnical Engineering a very interesting paper titled “Cosmic Theories and Greenhouse Gases as Explanations of Global Warming” (link to PDF). His study concludes that “the greenhouse gases cannot explain the up’s and down’s of the Earth’s temperature trend since 1750 and the temperature pause since 1798”. I will comment briefly on this rather easy to read paper, which alas should have benefited from a more thorough proof-reading, as there are quite a few spelling errors and/or typos.
1. IPCC and competing theories.
The IPCC concludes in his AR’s that practical all observed warming since the start of the industrial age comes from human emissions of greenhouse gases; the cause of GW (global warming) clearly is inside the Earth/atmosphere system. Competing theories see (possibly exclusively) outside causes at work: solar irradiance, galactic cosmic rays (GCR), space dust, planetary positions… As the temperatures calculated by the IPCC climate models (or better, the mean of numerous GCM’s), deviate now markedly from observations, Ollila writes that the “dependence of the surface temperature solely on the GH gas concentration is not any more justified”.
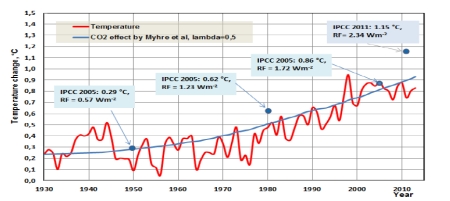
 In this figure (fig.1 of the paper) the blue dots represent the temperature anomaly calculated using the IPCC climate sensitivity parameter, and the blue line the CO2 induced warming postulated by the Myhre et al. paper. The red wiggly curve are the observed temperatures (t. anomalies): the huge difference with the IPCC dot in 2010 is eye watering!
2. The outside, cosmic models.
Ollila studies 4 cosmic models (which he blends into 3 combinations): variations of TSI and solar magnetic field, GCR, space dust and astronomical harmonics , as proposed by Nicola Scafetta. What many of these causes have in common, is that they could influence cloud coverage: the variations of cloud percentage is the elephant in the room! One percent variation in cloud cover is assumed to cause 0.1°C temperature change. Satellites shows that cloud coverage has varied up to 6% percent since 1983, which would explain a 0.6°C warming.
Combining space dust, solar variations and greenhouse gases together, he finds the following figure, extending to 2050 (fig.8 of the paper):

Here the red dot shows the average warming in 2010 given by the mean of 102 IPCC climate models; the black curve represents Ollila’s calculation. This figure shows, as many other authors predict, a (slight) cooling up to 2020, and then a 30 year period of practically no warming.
In another try, Ollila left out the putative influence of the increasing GH concentration. His justification are famous papers by Dr. Ferenc Miscolszi, a former NASA physicist, where this author proposes the theory that the impact of an increase in anthropogenic greenhouse gases will be cancelled out by a drying of the atmosphere (i.e. a decrease of absolute water vapour content). Miskolszi is able to reconstruct the past temperature variations beautifully, so this “outlandish” theory about a saturated greenhouse effect should not simply be discarded or ignored (read comments here and here).
This gives the following figure (fig.9 in the paper), with the black curve corresponding to the output of the calculations including only the SDI (star dust index) and TSI (total solar irradiance).
Now look at this: Ollila’s prediction of a coming longer lasting cooling period is nearly identical to the predictions based on the current (and next) very weak solar cycles !!!
3. The crucial role of water vapour
This whole paper stretches again and again the importance of getting the vapour content of a future climate right: the IPCC still assumes a constant relative humidity, i.e. an increasing water content with rising temperatures, and as a conclusion a positive feedback of the CO2 induced warming. Observations show that this has not been the case: the total water content of the atmosphere has not increased, as shown on this graph from http://www.climate4you.com (upper blue curve):
4. Conclusion
This is a paper I urge you to read. It clearly shows that climate science is far from settled, and that the naive, drastic and hurting climate politics proposed by EOL (end-of-life) presidents or advocacy groups could well try to influence a parameter (CO2) which has only a minor influence: this means much pain for very little or no gain!


