Archive for December, 2016

The Ewringmann report on pump tourism (part 4, last part)

December 23, 2016


titelIndex:

1. Part 1 (Introduction; Shutting down…)
2. Part 2 ( costs)
3. Part 3 (errors and the 3.5 billion cost)
4. Part 4 (Diesel bashing and conclusion)

This last part holds some musings on Ewringmann’s Diesel comments, and make as general conclusion of the report.

8. Diesel bashing

The green movements have taken delight in a new fad: the Diesel bashing. All evils, all bad pollution problems are the fault of the Diesel engines that foolish politicians do favor (at least in the EU) by lower taxes. These people do not remember or consider three important facts:

  • Diesel engines have a much higher efficiency as gasoline engines (about 35% versus 25%), so for a given work, they consume less fuel and emit less CO2
  • it was green policy to push the Diesel engine as a solution for lower CO2 emissions
  • high temperature/high pressure thermal engines emit more NOx and more nano-particles than lower pressure ones; as the newest gasoline direct injection engines (GDI) operate also at higher pressures, they have the same problems with these emissions as the Diesels (plus some 20 times higher CO emissions), but also have a higher power and better mileage than the traditional atmospheric models. See this figure from Delphi:

pm_gdi_eu6

There are no big differences in emissions between such an injection-fuel car and an EU-6 Diesel car; GDI cars may even exceed the EU6 norm (link of picture). If efficiency is what counts, the Diesel engine remains the king since its invention by Rudolf Diesel. For a more sober comment, read this comment “Do diesels have a future?“.

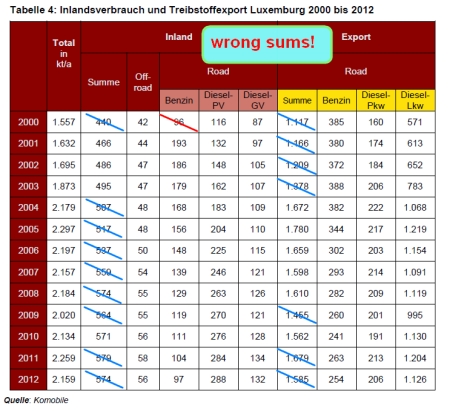
Now Ewringmann writes that about 85% of the external costs from the sold fuel come from Diesel cars or trucks. As Diesel fuel accounts for 83% (inland) and 84% (export) of the quantities of fuel sold, this fact is not a rocket-science conclusion, but self-evident. If all Diesels were forcibly changed to gasoline, 100% of the cost would come from gasoline! When the author asks for an “Überdenken der Dieselpolitik”, Diesel bashing won’t help. He should clearly say what he thinks: lower  (strangulate?) private and commercial transports on the roads by political regulation!

9. A short conclusion

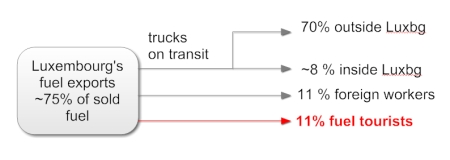
I ended part 1 of this discussion with many citations, where in my opinion Ewringmann was right. All these citations finally have one common argument: even when Luxembourg makes its fuels much more expensive so that the quantities exported will be drastically lowered, the environmental impact outside Luxembourg will practically remain the same. Luxembourg is not the culprit of the external costs happening abroad!

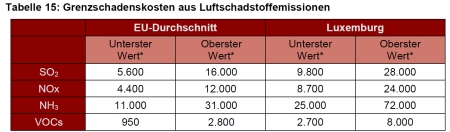
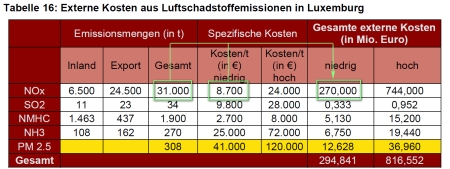
Ewringmann seems to be quite sincere in evaluating the benefits, but he really jumps the line when calculating the costs. Applying Luxembourgish cost-factors to fuel burnt outside the country is wrong, and this single “error” inflates the costs. Attaching fantasy prices to CO2 emissions is equally wrong, even if some German institutes or environmental organizations do favour extremely inflated numbers. CO2 has a clear price in Europe since many years; the price is low and does not increase as predicted. So this price of 10 €/ton should be used, and not an amount 10 times higher!

The report is easy to read, but shows the piece-wise writing (and possibly multiple authors), as Ewringmann acknowledges in his foreword. Childish errors like the rounding problems creeping up in some tables should be taboo in a publication from a serious institute.

Does the report help in making political decisions? I remain dubious, as the main lesson I take away after several careful readings is that the best option is to let things evolve without interference. As the last 3 years show a “natural” lowering trend of the fuel exports, let economy decide. A “natural” weaning will probably allow to compensate the tax losses, avoid to kill numerous jobs and economically devastate the commercially successful border regions by ill-conceived ideology driven politics.

(end of part 4, the last part)

The Ewringmann report on pump tourism (part 3)

December 23, 2016

titel

Index:

1. Part 1 (Introduction; Shutting down…)
2. Part 2 ( costs)
3. Part 3 (errors and the 3.5 billion cost)
4. Part 4 (Diesel bashing and conclusion)

In this 3rd part I will make some comments on rounding errors, and make a recalculation of the external costs that the author gives at 3.5 billion Euros.

6. Rounding errors

A really annoying error is that the author has problems with rounding and sums of rounded numbers. At many places the sums given in a table are different from the correct number by 1. The problem probably comes from summing in an Excel sheet non-rounded numbers, and giving in the tables the rounded numbers without checking that the sum of these rounded numbers is not equal to the rounded sum in the Excel sheet. This is a very basic error, that should not be made in a (probably expensive!) report written by a well-known institute.
As an example, let us look at Table 4 at page 26: all the sums with a blue strike-out are wrong; the sum “440” in the line corresponding to 2000 is two-times wrong: adding the numbers should give 341 (instead of 440), but the number 96 for the “Benzin” (gasoline) inland consumption probably should be 196 (which makes the correct sum 441):

tabelle4

7. Re-checking the scary 3.5 billion cost number

At page 49 we find the sentence repeated by all news articles I have read: “ist mit externen Umwelt-und Gesundheitskosten von insgesamt 3.5 Mrd. Euro pro Jahr verbunden”. In English, the authors says that the fuel sold in Luxembourg in 2012 (for this year has been used for the calculations) has external costs for the environment and health of 3.5 billion Euro. The positive impact on the GNP is 1.8 + 0.26 =2.06 billion € .

The costs which can be attributed to the fuel sold are essentially the costs related to the emissions of pollutants, and those from CO2 emissions. Road accidents will also happen when all vehicles run on electricity, they should not appear in this calculation!

The numbers for the emissions costs relate to 2008 (there is a real confusion in the report regarding the years corresponding to given numbers, because they vary from 2008, 2010 and finally 2012 is taken in the status quo discussion). The inland fuel usages (in kt) in 2008 and 2012 were 573 and 574, and the exported numbers 1610 and 1586. As these quantities do not differ by more than 5%, we will use the emission costs given in part 2 for the calculation of total costs in 2012. The price of 1 ton CO2 is taken as 10€, a number that many experts estimate being the EU emission price until 2020 (see for instance here). The up to 50 times higher number given by Ewringmann at page 32 should be considered as green fantasy.

The following picture shows the costs for inland, exports and the grand total:

estimated_costs_2012

So even if we accept that all costs (inland and export) should be summed (I repeat: I do not agree!), the range goes from 264 to 661 million Euro: this is a staggering difference by nearly one order of magnitude for the lower range, and by a factor of 5 for the high range value with respect to the scary 3.5 billion amount.

The 3.5 billion Euro number is pure and extreme guess work, a fantasy number rooted in non-real, extreme CO2 costs and in a faulty calculation of emission costs.

(end of part 3)
(to be continued with last part 4 )

The Ewringmann report on pump tourism (part 2)

December 22, 2016

titel

Index:

1. Part 1 (Introduction; Shutting down…)
2. Part 2 ( costs)
3. Part 3 (errors and the 3.5 billion cost)
4. Part 4 (Diesel bashing and conclusion)

_____________________________

In this second part I will write on the different costs calculated in the report (which usually speaks of “external costs”). I will start with the costs associated to traffic inside the Luxembourg borders, then comment on the so-called global “climate” costs, and finally look carefully at the total costs caused by the emissions (=pollutants) attributed to the fuel bought at Luxembourg’s gas stations.

3. Costs from the traffic inside Luxembourg

The following table (an edited original Tabelle 3, p.23) shows that the average external cost per driven km is about 0.11 € :

externe_kosten_lu_fzgkm

The cost factors in column 3 are Umweltbundesamt (UBA) numbers, and include emissions of GHG, pollutants, procuring the fuel (but not the price of the fuel itself), damage to the environment, health and costs of accidents. I will not discuss the validity of these numbers (which could be exaggerated, knowing of UBA’s tendency for dramatization). A 2008 report from the University of San Francisco comes to a similar conclusion, giving for instance a cost of 0.1146 U$ per mile driven on a Honda Accord, which is close to 0.0703 €/km, the number the UBA uses for gasoline cars (lines “Benzinfz.” in the table). The conclusion is that 7.413 billion km of traffic have external costs of 0.784 billion € (I use the term “billion” in the US sense, 1 billion = 1 Milliarde = 10^9). In my opinion, calculating the costs from the real driven km’s is the correct manner to do. The costs per km are IMHO surprisingly low, similar to the fuel costs per km of a mid-size car.

This result could be the final word of the report; on the positive side of the balance are 2440 jobs and a contribution to Luxembourg’s GNP (gross national product) of approx. 1600 million € in 2012 (p. 47); on the negative sides are costs of 784 million € and 28 millions which must be paid to the Kyoto fund. This gives a positive balance of  788 million € plus 2440 jobs.

If the report would have respected its mandate, it should conclude with the advice to leave everything as it is and not to try to destroy a very positive feature of Luxembourg’s economy by so-called “environmental” political decisions. But that is not the case, as will be shown in the next two discussion points.

4. Costs to the climate (“Klimafolgenkosten”)

In chapter 3.1. the author tries to evaluate the climate relevant costs from all the quantities sold. This is a clear example of shifting the focus from examining in-border  costs to “global” costs, of which only a tiny part could eventually attributed to Luxembourg.  Actually, even ignoring this questionable focus shift,  this whole chapter should be scrapped, as the uncertainties in putting numbers on the “climate” or “CO2” costs vary so enormously as to make any calculated result absolutely meaningless. In page 34, Ewringmann acknowledges that these attributed climate costs are, depending on the methodology used, anywhere between 16 and 3000 million Euro (yes: 3000 million, this is not a typo!). The only lesson told by such an extreme range is that the “science” to evaluate these climate costs actually is unusable, and should be considered as totally immature and unsettled.

So I will not write more on the chapter 3.1., but will pass on to the next chapter 3.2. on the costs of emitted pollutants.

5. Costs of traffic induced emissions.

Here the author again does not refrain from calculating the emissions costs from both the in-border used fuel and the exported fuel, a decision I strongly disagree with. In my opinion he should have made his calculations on the first category, and ignore the costs of pollution happening outside the country.
The author first gives a table showing that the costs of a pollutant are not a given number, but vary with the country where the pollution does occur. As these costs are modulated by population density, mean income etc., they are nearly double for Luxembourg than for the average EU:

grenzschadenskosten_luftschadstoffemissionen

This table of the costs in €/ton (metric ton) does not give those of PM2.5 fine particles, which are assumed anything between 81400 and 392600 €/t. The author gives a total of 308 tons of PM2.5 emitted from all the fuel sold; with 75% exported, this amounts to an inland cost in the range of [6 – 30 million €] and an out of border cost to [18 – 90 million €].

Now comes what I consider a serious error: in calculating the total costs, the author simply multiplies the total pollutant quantities with the unitary costs applicable for Luxembourg and finds a range of [295 – 817 million €], with rounded numbers:

tabelle16

What he should have done is to multiply the in-border emissions with the Luxembourg costs and the out-border emissions with the EU27 average (as probably precise numbers and quantities for the 3 neighbors Germany, Belgium and France are not available); this brings down these costs to a range [199 – 596 million €]. The next scheme shows the correct calculation, the two arrows per pollutant give the low and high ranges of the costs:

lu_fuel_emission_costs

The number of 817 million is what the media focused on; as shown there are at least two good reasons why this number is wrong:

  • the calculation method is wrong
  • the range of the UBA unitary costs for the PM2.5 (the lower costs are for out-of-town emissions) is unbelievable large

and finally, and once again, I disagree completely in adding the costs related to exported emissions to a total which is meaningless in the frame of the mandated report (and should be given as a curiosity at most).

After correctly writing (p. 40) that “…ist kein Anlass, Luxemburg pauschal als Verursacher dieser Kosten anzusehen”, the author by a twitch of logic concludes that “Dennoch ist es durauch plausibel und gerechtfertigt, Luxemburg…die Bilanz der Gesamtexternalitäten vorzuhalten”.  No, it is not !

 If we include the costs of inland emissions into the previous balance, we still find a largely positive balance of [582 … 718] million € plus 2440 jobs. But this calculation is moot, as the report’s mission was to focus on the costs of the pump tourism (in the larger sense of total exported fuel); there is absolutely no reason to include the inland costs due to pollutants in this analysis, as these costs are almost independent of and not caused by the pump tourism.

(end of part 2)
(to be continued with part 3)

________________________________

A remark added the 23-Dec-2016:

a. The WHO (World Health Organization) sets the standards (or guidelines) for air pollution. Here are the guidelines for the annual or other time-interval mean concentrations:

NO2: 40 ug/m3
SO2: 20 ug/m3 as the maximum 24h mean
O3  :  100 ug/m3 as the maximum 8h mean
SO2: 20 ug/M3  as the maximum 24h mean

It should be noted that in 2014 92% of the world population did not meet WHO standards. This is a clear sign that at least some of these guidelines might be over the top. An example can be found in this report on O3 and PM2.5 pollution in the industry free Great Smoky Mountains National Park: In the 7 years 2008 to 2014, the yearly mean of the 8h averages exceeded 40 ppbV (= 86 ug/m3) during 3 years. The EPA wants to limit O3 exposure to 60-70 ppbV, close to the natural background in the GSMNP. In 2016, the O3 limit was exceeded for several days in 8 of the 24 US National Parks; the Sequoia NP holds the record with 92 days of exceedance during the year 2016 open season (link).

b. NO2 annual levels:

The following map from the EEA shows the 2013 mean annual NO2 levels: clearly large cities and industrial regions usually exceed the 40 ug/m3 limit (red and brown points).

2013_eu_no2_annual_map

The Ewringmann report on pump tourism (part 1)

December 21, 2016


titel

Index:
1. Part 1 (Introduction; Shutting down…)
2. Part 2 ( costs)
3. Part 3 (errors and the 3.5 billion cost)
4. Part 4 (Diesel bashing and conclusion)

1. Introduction

Dr. Dieter Ewringmann from the green-leaning FiFo Institute has delivered his long awaited report on what the Luxembourgers call “pump tourism”. Luxembourg is situated at the crossroads of important North-South and to a lesser degree, East-West roads and has usually lower fuel prices that its neighbors. So not astonishingly trucks and cars running through Luxembourg fill their reservoirs here; on top of that about 150000 people come each day from abroad to their Luxembourg workplace, and as to be expected, fill up here. Finally a relatively small number of people living abroad in the boundary region drive to Luxembourg’s fuel stations to buy fuel (and cigarettes, coffee and alcoholic beverages). All this makes that the major part of fuel sold in Luxembourg is exported, as shown in the following picture:

lu_fuel_exports_pcs

The expression “pump tourism” is usually applied to the 75% part of fuel exported, even if strictly speaking it should apply only to the 11%. The problem with this situation is the accounting scheme adopted in Brussels and Kyoto, where the CO2 emissions of a country are calculated from the fuel quantities sold in that county, independent from the fact that a more or less greater part is directly exported. I always recall my opinion that this is an idiotic accounting convention, which has not been applied to other situations of trans-border commerce. For instance the VAT taxes on e-commerce are now (rightfully in my opinion) calculated and paid at the buyers location, a fact that hurt Luxembourg badly as it lost for instance these taxes formerly paid by Amazon in Luxembourg.
Our Ministry of Environment and Sustainable Development has mandated Ewringmann to quantify the costs of this fuel situation, and to give the costs and benefits of a change through political decisions (what means in practice decreasing the price differential with the Luxembourg neighbors).

The Ewringmann report stands and falls with the notion of “external costs“. He promotes that all costs from selling fuel should be accounted for by the seller; this is a standpoint that I can not accept. In my opinion the costs should by applied and accounted for at the place where they are caused by the consumption of goods. As an example, nobody would think to apply the diabetes-risk costs coming from the consumption of sugary pastry or the costs implicit in textile articles to Germany, when German shops sell these items in Trier to the many Luxembourg customers taking the articles back home. So as to be expected, his external costs are huge, so as to dwarf the benefits. Our news papers have reported mostly on this, as it makes for some good goose-pimp emotions.

I read the full report carefully several times. The style and presentations are clear and easy to understand; I found what I think is an important error in the calculation of the cost of pollutants. As the report has been mandated by a green ministry, there are many pages that are superfluous IMHO. Nevertheless I would suggest to read the full report, and not the short version that hides many important reflections.

I will give full citations as they are in the report, as most readers will probably be fluent in German language.


2. Shutting down? Examples where Ewringmann is right.

The report contains many places where the author insists on what are the consequences of shutting down the fuel exports.

  • wenn Luxemburg seine Grenzen für ausländische Fahrer schliessen… würde, so träte eine echte Verringerung der externen Gesamteffekte… nur in dem Masse ein, in dem die bisher in Luxemburg tankenden Autofahrer künftig absolut weniger tanken und weniger Kilometer zurücklegen würden (p. 9).
  • …die gewonnen Ergebnisse sind vorsichtig zu interpretieren. Luxemburg kann nicht als Verursacher dieser negativen Gesamteffekte angesehen werden (p. 20).
  • Wenn dieselbe Treibstoffmenge im Ausland getankt würde, liesse sich weitgehend dieselbe Summe an externen Kosten berechnen (p. 28).
  • Die im Ausland anfallenden Kosten des Luxemburger Treibstoffverkaufs enstehen zwar durch Autofahrer, die in Luxemburg tanken, sie würden aber zu einem grossen Teil auch dann enstehen, wenn Luxemburg seine Tankstellen schliessen, für Ausländer sperren oder durch extrem hohe Steuersätze für Ausländer…unattraktiv machen würde (p. 40).
  • Ebenso falsch ist es, den totalen Ausstieg aus dem Treibstoffexport zu fordern und damit die Erwartung zu verbinden, alle am Export hängenden externen Kosten “vernichtet” zu haben…Solange (die ausländischen Fahrer) ihren Gesamtverbrauch nicht einschränken, spielt der Ort desTankvorgangs keine Rolle (p. 78).
  • …ein im Regierungsprogramm erwähnter Ausstieg aus dem reinen Tanktourismus (führt) schon rechnerisch nicht zu einem wirklich relevanten Abbau der negativen Umwelt- und Gesundheitseffekten…(p. 79).
  • Beim Transitverkehr per LKW ist dagegen zu erwarten, dass trotz der Verlagerung der Tankvorgänge ins Ausland in starkem Masse die Luxemburger Autobahnen und Strassen weiterhin benutzt…werden (p. 79).
  • …die im Inland anfallenden externen Kosten (würden) zu 58% erhalten (bleiben) (p. 80).

These are clear, intelligent and refreshingly sincere remarks, that seem to be ignored by agenda driven commentators.

In the next part 2 I will comment on the so-called “climate costs” and on the pollution attributed costs.

(end of part 1)

Greenhouse gas emissions from energy and transport (DE,FR,LU)

December 19, 2016

In our news papers, Germany’s Energiewende appears nearly unanimously as a success story, and as a demonstration of political decisions that all countries should adopt. The official EU politics look heavily to Germany for its decisions concerning “climate control” and weaning from fossil fuels. One aim is to electrify transport, and a new fad that has developed very quickly is “Diesel bashing” (read this comment from the Scientific Alliance for a more sober appreciation). All EU countries must submit every year an inventory of their GHG emissions (or what they think they are), which goes into a big database, the latest called UNFCCC_V19.  This extremely large database of nearly 550000 lines is freely accessible at the EEA as an Access .mdb file or a csv file (link). It is a treasure waiting to be exploited by everyone interested in questions of energy, transport and emissions.

In this blog I will surf this database for 3 countries: Luxembourg (LU), Germany (DE) and France (FR). The questions to ask will be:

  • how have the greenhouse gas emissions changed in the transport and energy sectors
  • what are the percentages of the transport emissions related to those of the energy sector?
  1. Emissions in the energy sector from 1990 to 2014

The energy sector is a very large one: it contains electricity production, transport, manufacture etc…
The database expresses the total GHG emissions in CO2 equivalents (which means according to their global warming potential (GWP) relative to CO2; as an example, methane CH4 has a GWP over 100 years of 25). The quantity of the emissions is given as a mass, expressed in the SI unit Gg (Gigagram); 1000 Gg = 1000*10^9 g = 1 Million metric tons.
The following figure shows how the emissions have changed since 1990. As Luxembourg’s values are tiny compared to those of its neighbors, I give them on the right vertical axis. The x-axis holds the years, with 1 corresponding to 1990 and 25 to 2014.

energy_defrlu_1990_2014

Clearly all 3 countries show a decline in their emissions: relative to their maximum, the percentages rounded to the next integer, are -26% (DE), -22% (FR) and -19% (LU). The decline in Germany is more or less monotonous; a similar pattern starts only in 2005 for France, whereas the situation in Luxembourg is completely different. After a very big decrease from 1993 to 1998, the emissions rise steeply, exceeding even the prior maximum. From 2005 on, the decline is the general tendency. The 2014 per capita emissions in [kg] are the following: 9437 (DE), 4853 (FR) and 17096 (LU). The low number for France is clearly due to its carbon-free nuclear electricity production; the following picture shows how the different countries figure in this no-carbon competition (note the uncomfortable situation of Germany, showing a rather unsuccessful Energiewende for the time being):

non_carbon_electricity_share

The extraordinary high per capita emissions of Luxembourg are due mostly to the transport sector. We know that about 65% of all LU energy GHG emissions come from the transport sector. Due to an (in my opinion extremely silly) convention, all fuel sold in Luxembourg is calculated as if it was used in Luxembourg. But this is not the case. As a small country lying on many North-South transportation roads, and having normally lower fuel prices than its neighbors, about 80% of the fuel sold at the pumps is directly exported. So the Luxembourg record does not reflect a real behavior, but is simply the result of a certain bookkeeping convention, that Luxembourg has foolishly accepted in the early 90’s. The rapid increase of 39% for the period 2000-2012 is mostly a fingerprint of the rise in exported fuel (an increase by about 42%, compared to an in-country increase of only 30%). The next chapter will look at the transport emissions, and their part in total energy emissions changed from 1990 to 2014.

2. Emissions in the transport sector from 1990 to 2014

Here is a plot of the GHG emissions from transport; the same units and convention as mentioned above apply.

transport_defrlu_1990_2014

We see that the German emissions start falling in 1999, and rise again 10 years later, possibly a fingerprint of the success of big German cars! The French emissions start decreasing in 2004, and except a small up-tick in 2011 continue to fall. Luxembourg’s down starts only in 2005 for 4 years, rises again for 2 years, and since 2012 falls at about the same rate. If we look at the percentages of the transport emissions versus the total energy emissions, we obtain the next picture:

changes_in_percentages_defrlu_1990_2014

France and Luxembourg show the same pattern, whereas the percentage of German transport emissions w.r. to total energy emissions is practically constant. So we have three different behaviors: after 2000, the part of the Luxembourg transport emissions is more than 8 times less than before; for France, there is not much of a change whereas Germany has lowered a slightly rising percentage to a constant.

3. Conclusion

What could remain puzzling, is the strong drop in Luxembourg’s total energy emissions between 1993 and 1998. In my opinion the major part can be explained by the shutdown of a big chunk of Luxembourg steelworks and the start in 1994 of only electrical steel making and the scrapping of all blast furnaces. As the electricity is imported, the GHG emissions from its production are not included in the Luxembourg balance, but in those of its neighbors. Again a totally incomprehensible decision taken in Brussels which makes pictures like those given in this blog suggest a reality that does not exist!

In a next blog, I will comment on the Ewringmann report pump tourism, which was mandated to quantify the gains and losses due to the cheaper fuel prices in Luxembourg.

TIR Lëtzebuerg 2016, the Rifkin report: conclusion

December 3, 2016

Index:

Part 1: ..ENERGY (1/2)
Part 2. ..ENERGY (2/2)
Part 3: ..MOBILITY
Part 4: ..BUILDINGS
Part 5:  ..FOOD
Part 6:  ..INDUSTRY
Part 7:  ..FINANCE
Part 8:  ..SMART ECONOMY
Part 9:  ..CIRCULAR ECONOMY
Part 10: PROSUMERS & SOCIAL MODEL
Part 11: EXPLORING ECONOMIC BENEFITS
Part 12: My conclusion

___________________________________

Having spent more than two weeks on reading the full report and writing down my comments in 11 parts, time has come for a concise conclusion:

  1. The time spent reading the report is not wasted. It contains many concrete numbers and statistics on Luxembourg and its energy use, and many well written reflections.
    The report suffers greatly from too much repetitions, too much buzzwords “à la mode” streaming down like a tropical rain. 450 pages are far too many; with a better editing a more concise report should have been possible on 200 pages maximum.
  2. The exclusive and mandatory usage of renewable energy (here mostly solar PV and on-shore wind) is an illusion, not feasible as the intermittency asks for ever more complex systems, and the needed electricity storage solutions still do not exist at the magnitude and at the cost needed. The eventual advantage of many small micro-producers is to a large part eaten away by the extraordinary complex smart grid needed to exploit the micro-production. The suggested energy future is devilishly complex, and a complete reversal of the KISS (keep it simple, stupid) paradigm that was so successful for many years.
  3. The future suggested by the TIR report is ambiguous, even contradictory: on one side, the shared and circular economy should foster a myriad of small prosumer driven enterprises, on the other side the practical working of this new economy demands a collection of data at a magnitude that is breathtaking: the IoT finally establishes an all-encompassing web with a total intrusion into all aspects of  life. Actually, the proposed future does not leave privacy as an option anymore.
  4. Will this report be a great help for our politicians?
    I strongly doubt it. Sure, suggestions like better thermal isolation in all buildings or making ICT teaching stronger will be accepted, but they do not represent something new, and they are far from visionary. The excesses of the report makes its acceptance difficult; sure, there will be much lip paying service, but my best guess is that the caravan is moving on.

TIR Lëtzebuerg 2016: the Rifkin report (part 11)

December 3, 2016

Index:

Part 1: ..ENERGY (1/2)
Part 2. ..ENERGY (2/2)
Part 3: ..MOBILITY
Part 4: ..BUILDINGS
Part 5:  ..FOOD
Part 6:  ..INDUSTRY
Part 7:  ..FINANCE
Part 8:  ..SMART ECONOMY
Part 9:  ..CIRCULAR ECONOMY
Part 10: PROSUMERS & SOCIAL MODEL
Part 11: EXPLORING ECONOMIC BENEFITS
Part 12: My conclusion

___________________________________

This comment is on the last chapter of the report, titled “EXPLORING THE POTENTIAL ECONOMIC BENEFITS OF THE TIR. INNOVATION SCENARIOS” (p.420 to 455).

This chapter contains much of what has been written in previous chapters, as the uttermost importance of energy (I agree with!). We are told that in 2016 Luxembourg spends 2 billion € for its combined energy needs, a sum that the adoption of the TIR proposals should lower by 250 million per year (p. 431) during the next period up to 2050. This approx. 10% economy is much less spectacular than the repetition of “zero marginal cost” suggests!

We find again speculations that are simply unbelievable: at page 421 we are told (by the Stanford report) that the avoided health costs effect might be over 3 billion € per year, if a 100% adoption of renewable energy will be implemented. This 3 billion number is pure guess, as the total healthcare costs are about 4.5 billion annually!

Saying that Luxembourg wastes today over 80% of its energy resources (p. 422) also seems largely overblown, as thermodynamic and other physics laws do not permit a 100% efficiency. As an example one could say that adopting solar PV wastes more than 75% of its potential (the max. efficiency being not higher than 25%, and probably much lower in real operation with dust-covered or partly shaded panels).

Luxembourg should by reducing its energy requirements and adopting at least 70% in-country produced renewables switch from a capital-intensive to a labor-intensive economy. As the shift to more ICT is suggested constantly, a figure from Statec (2013, p.427) rises some questions: per million € of added value the energy sector fosters 4 jobs, the ICT 4.9, not a spectacular difference!

This last chapter again makes some calculations on the costs and saving brought by adopting at a large scale solar PV on roofs. In all these scenarios, the uppermost important question of how to guaranty a reliable electricity when it is produced nearly exclusively from heavy intermittent sources is neither asked, nor given a serious answer. Storage solutions that still do not exist at the magnitude and cost needed after more than 100 years of research, seem magically to spring into existence. And the continuous refusal of nuclear energy (a non-intermittent and extremely reliable source) does not help to solve this dilemma.

Starting at page 435, several tables give scenarios on future population and energy use. The first table from Statec (the “reference case” suggests a nearly constant energy need (about 25 TWh) between 2015 and 2050, even with a population going up to over 1 million and a triple GDP. The corresponding TIR scenario with a 100% use of renewable energies in 2050 reduces the energy demand to about 17 TWh, all other parameters being the same. I doubt that a drop in conventional energy use to zero will be possible, and I think that 100% renewables ( PV and on-shore wind) without nuclear will be more of a a wishful and rather naive thinking than a physical/technical possible feature.

(end of part 11)

TIR Lëtzebuerg 2016: the Rifkin report (part 10)

December 2, 2016

Index:

Part 1: ..ENERGY (1/2)
Part 2. ..ENERGY (2/2)
Part 3: ..MOBILITY
Part 4: ..BUILDINGS
Part 5:  ..FOOD
Part 6:  ..INDUSTRY
Part 7:  ..FINANCE
Part 8:  ..SMART ECONOMY
Part 9:  ..CIRCULAR ECONOMY
Part 10: PROSUMERS & SOCIAL MODEL
Part 11: EXPLORING ECONOMIC BENEFITS
Part 12: My conclusion

___________________________________


This part 10 comment is on the chapter PROSUMERS & SOCIAL MODEL (p. 383 to 419)

The main subject is that the future economic model will be one of shared economy, where the citizens are happy not to own some good, but to share their own goods and services with others. This sharing will be done not for financial gain, but rather moral satisfaction. Whenever possible, the future prosumers ( = consumers and producers) will assemble into cooperatives. A very big problem will be the level playing field between this type of economy and the still existing “capitalistic” one, so the state must insure strict control and guidelines: for instance every participant in sharing must use a unique web portal (p.416). This inherent loss of freedom is perceptible throughout the chapter, but usually well hidden under well-meaning phrases. This new economy should be 100% electric (p.412); I do not  understand why non-electric energy forms should be banned (solar heating for instance is non-electric).

The chapter contains one sentence that I find excellent: at p. 415 we find that “every citizen should have the right to disconnect”  i.e. he should be allowed to become unreachable. I just wonder how with the myriad of IoT’s gathering data all the time this pious wish should become existent. I see the coming all-invasive state more inclined to forbid that the citizen becomes unreachable and to try its uttermost not to lose control!

At page 404 the ominous Global Warming shows up again (quite unnecessary!), with numerous potential catastrophes in the making.

The chapter has many lines on education and schooling. The classification of “older education” as authority driven repetitive learning is so cliché! Collaborative learning is nothing new, but it seems that some authors still suffer from a post-school trauma. At page 418 it is asked that coding (programming) in school should begin as early as possible. I am sympathetic with this idea, but am not sure that future ICT awareness will need programming skills for everybody.

As the economy changes from the “old” capitalistic model to the new sharing, producing goods will be more and more automated and need less and less workers, but the social economy will become very labor intensive. This could well be the case, but I do not quite understand how we should create more and more micro-entrepreneurs, and produce with less and less people. The cost of the social economy (which might well be desirable) could be extravagant, and must be paid somehow.

To conclude, this chapter has many aspects of well-meaning, generosity, willingness to give etc. that could be found in a religious teaching, or in one of the first communist ideas. I think that open source and non proprietary goods have a great future, but I am skeptic of their potential to become the exclusive feature of the future economy.

(end of part 10)