Archive for May, 2018

AQI: air quality confusion (5, last part)

May 29, 2018

This is part 5 (the last part).

Click on the links below for the other parts.

Part 1,  2,  3,  4.


8. The Luxembourg Meng Loft AQI (LuxAQI)

8.1. An introduction to the LuxAQI

The 7th May 2018 our minister of Environment presented a new app called “Meng Loft” (which means My Air) for smart-phones (IOS and Android). The app has been developed by the company 4sfera Innova (from Catalonia) together with the Environment Agency.

4sfera Innova specializes in air quality related software and created an Europe Air app in 2013 (it’s website seems to be dormant, the last update is from May2014).

The AQI for Luxembourg (let’s call it LuxAQI) is quite different from the EAQI: there are 10 quality levels from “Excellent” to “Miserable” (in French from “Excellent” to “Exécrable”) and also 10 color shadings.

The core pollutants used are O3, NO2 and PM10. Only 4 stations (2 in Luxembourg-City, Esch-Alzette and Beidweiler) measure PM10’s, so that for instance the whole Northern part of the country of Luxembourg has no PM sensor.

The app is nicely designed; the following picture is a screenshot from an Android tablet used at Bettendorf, 28 May, 17:34 local time (15:34 UTC):

The pointer “My location” shows that the LuxAQI has been computed for the region of Bettendorf; if one launches the app being outside of Luxembourg (or with locations services unavailable) the screen gives an average for the whole country (a nice feature!). Some other features of the app will be introduced later.

The next picture shows the naming of the quality bands and break-points used:

If I understand correctly, the 1h values are used for O3 and NO2, and 24h values for PM10’s. As with all other AQI’s seen, the sub-AQI with the highest index defines the Meng Loft LuxAQI.

My first reflection seeing this new app was “boy, 10 levels, 10 colors, is that not a bit too much?” Digging deeper I actually wonder why tiny Luxembourg has stubbornly ignored the harmonization efforts of Brussels EU Environmental Agency and has not simply chosen to use the EAQI. So we have here a situation which instead of clarifying will in my opinion add to the overall confusion. Is a deeper cause that 4sfera Innova had this app lying in a drawer and was good in salesmanship?

The next three pictures compare the LuxAQI with the corresponding EAQI for O3, NO2 and PM10. Note how clear and uncluttered the EAQI is w.r. to its new sibling!

Note that The EAQI “Moderate” category extends for all 3 pollutants over the LuxAQI “Très médiocre” which translate approximatively to “poor”!

The LuxAQI uses a “geostatistical” model to calculate the AQI from the surrounding readings up to a cell of 1km2 area. I could not find any further information on the model used, and I am highly suspicious on the ability to milk the PM10 data of the 4 stations to deliver a modelled value for any location in the Northern part of Luxembourg.


8.2. The problem with rural and city stations and the “highest index trumps all” strategy

In Luxembourg Vianden is the archetype of a rural station: the measuring station is not located in the small town of Vianden, but much higher up on the border of the basin of the SEO pumping storage facility. There is only minimal traffic, air is very pure (practically no NO2 and PM10) and solar UVB radiation is unfiltered by aerosols. As the region contains large forests (deciduous and not) there is during warm summer weather a healthy natural out-gasing of terpenes and isoprenes from the trees. Both volatile gases are O3 precursors. So it does not come as a surprise that “natural” O3 levels are high and do not diminish rapidly during nighttime due to the absence of O3 destroying NO. In Luxembourg-City the situation is exactly opposite: PM10 and NO2 levels a relatively high, O3 levels lower and fall off during nighttime in the absence of UVB but presence of O3 scavenging NO. The next 2 pictures show this for Vianden and Luxembourg Pl. Winston, a high traffic area:

At Vianden O3 values do not go lower at night than about 50 ug/m3 and than rise again,  wheres at Pl. Winston the lower values of 30ug/m3 linger for a longer time. The usual pattern is normally much more smooth at Vianden than at Pl. Winston. (for a still clearer picture please look at the addendum).

But look carefully at the legends: Vianden’s air quality is POOR (index 7, deep orange) whereas that of Pl. Winston is relatively good (“assez bon”, light green).

Let’s take a look at the NO2 and PM10 situation for both stations. The next two pictures show the NO2 pattern:

At Vianden No2 levels never exceed 10 ug/m3 whereas at Pl.Winston the oscillate around 45 ug/m3, with a peak value at least 6 times higher than that at Vianden.

Now look at the daily PM10 levels for the last week:

The PM10 levels at Vianden are very low, never exceeding10ug/m3; at Pl. Winston they are constantly two to three times higher!

So let us summarize the situation:

Vianden  LuxAQI= POOR

O3max = 150  NO2max < 10  PM10max < 7

PlaceWinston (Luxembourg-City) LuxAQI = Relatively GOOD

O3max = 60  NO2max = 60  PM10max = 22

The 2.5 times higher natural O3 levels put Vianden into the POOR category, whereas at Pl. Winston the much more dangerous and mostly anthropogenic PM10 and NO2 levels (3 and 6 times higher) are simply ignored and do not change the “relatively Good” classification!

Conclusion:

In my opinion the LuxAQI classification and break-point table introduced by “Meng Loft” is a bad choice: instead adopting a European standard, Luxembourg’s Environmental Agency has chosen for reasons unknown to go it’s own way, adding confusion to an already complicated matter. The Meng Loft app is visually satisfying and easy to use, but it suggests a precision that is more of a virtual character that of a physical reality.


9. Overall conclusion

The title of this 5 part comment was “air quality confusion”. I guess that the enumeration of the different AQI’s is a strong argument for the validity of the “confusion” qualifier. What all AQI’s wrongly point at is that a complicated situation can be well defined by a single number. The AQI’s suggests a scientific precision that is and can not exist. Increasing the number of the different levels as does the LuxAQI is simply an exercise in futility which adds to the confusion.

All AQI’s take the highest sub-index as the relevant parameter to define the air quality of the moment. I am not comfortable with that choice (even if everybody seems to accept) as it leads to a mis-qualification of clean air when natural O3 levels are higher.


(end of the 5th and last part).

Addendum 1:

A much clearer picture showing the different O3 pattern for rural Vianden (i.e. Mont Saint-Nicolas) and the urban traffic location at Luxembourg-Bonnevoie is given below (screenshots taken the 30May2018, 15:35 local time): the nightly minimum at Vianden is about 60 ug/m3, whereas it is lower than 10 ug/m3 at Bonnevoie.

Screenshot_20180530-153410

Screenshot_20180530-153423

Addendum 2:

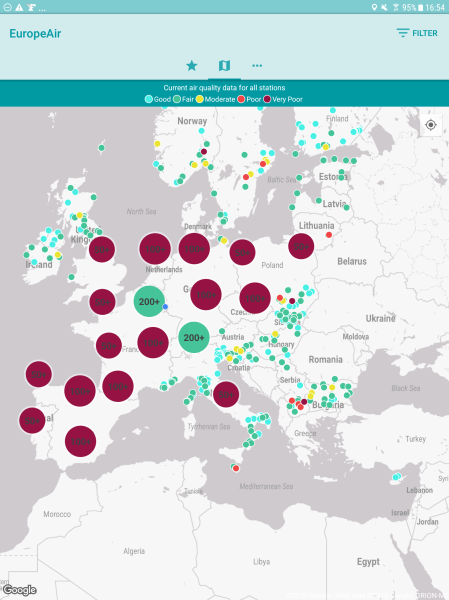
4sfera Innova also has its own app called EuropeAir (Android version checked) which is easy to use and gives the standard EAQI . Here a screen-shot of today (30May2018); zooming in gives all the stations and the actual measurement data, but no time-graph of past values. The filter allows to select one pollutant (e.g. O3) only.

EuropeAir.png

AQI: air quality confusion (4)

May 27, 2018

This is part 4.

Click on the links below for the other parts.

Part 1, 23, 5.


7. The EU AQI’s

As everything in Europe is complicated, so are the AQI’s. The oldest index is the CAQI  which has different quality bands names, color scheme and break-points than the newest EAQI.

7.1. The CAQI

The  CAQI index was introduced by the CiteAir (Common Information to European Air) project in 2006. It was revised in 2012 and is meant as an index for the air in the cities. It uses the concentrations (measured in ug/m3) of 3 core pollutants (O3, NO2, PM10) with PM2.5, SO2 and CO as optional. The different sub-indexes run from 0 to 100 as defined in the following table (link):

The table shows that the index break-points are not proportional to the concentrations for all pollutants as for instance for NO2 the “Very low” range [0..50] covers 0…50 ug/m3 whereas the “High” range [75…100] covers 200…400 ug/m3.

The names of the different categories relate to the magnitude of the index, and not the quality of the air. As customary, the highest sub-index defines the CAGI.  Note that the sampling period usually is 1 hour. The CAQI can be viewed on-line at http://www.airqualitynow.eu/

Clicking a city gives more detailed information, as shown for Paris:

Clearly the CAQI is heavily “French” leaning, as the vast majorities of cities are in France.

This is probably the reason that the DG Environment commanded a research to Ricardo Energy & Environment which delivered in 2013 a paper defining an harmonized EAQI. The proposal was very similar to the EPA AQI, with an identical number of pollutants and an index running from 0 to 500; the names of the different categories were different. This project seems to have been a dead-end (due to it’s US similarities?) and never has been officially applied.

7.2 The EAQI

In November 2017 the EU introduced the EAQI = European Air Quality Index with a web-site showing the live-data. It is very difficult to find precise literature for this index which is somewhat similar to the CAQI, albeit with a different color scheme, a renaming of the categories and most important, different break-points. So most of the following information has been extracted from the excellent airindex.eea.europa.eu

First the naming of the 5 categories is now relevant to the air quality and not the magnitude of the index, the colors go from turquoise to brown and the indices from 0 to 100 relate to concentrations in ug/m3 as shown:

The numerical ranges of the indices are here (often the upper bound is given as equal to the lower bound of the following category which does not easy a decision for qualifying if by chance the data fall on a boundary):


I wrongly presumed that the break-points for each category are defined as they are for the CAQI.

The graph for the EAQI in Epinal (France) shows that the category is POOR as the PM10 concentration exceeds 71 ug/m3.  As this is an 1h concentration, the EAQI break-point for PM10-POOR seems to be lower than in the CAQI table.

Finally after quite some detective-investigation, I found legends at the provisional web-site
www.eea.europa.eu/data-and-maps/dashboards/up-to-date-air-quality-data
which confirm those of the table at the start of chapter 7.2. See that here upper and lower bound values coincide!


Note how different these break-points are  from those of the CAQI, which adds one more level to the overall confusion!


Conclusion:

Hopefully the EAQI will be the definitive step in harmonizing an AQI. But I have some doubt that these break-points will be stable for the coming years. As the trend goes to an ever tightening of the tolerated levels, the chances for future stability seem poor.

The web site airindex.eea.europa.eu betters that of the CAQI  enormously as it includes measuring data all over Europe and shows the time series for the different pollutants.


The last part 5 to be followed asap concludes this series with a discussion of the new Luxembourg AQI introduced a couple of weeks ago with a smart phone app called “Meng Loft” , and which shows that adding confusion is not a privilege of big countries!

(go to part 5)

AQI: air quality confusion (3)

May 23, 2018

This is part 3.
Click on the links below
for the other parts.

Part 12, 4,  5.

6. The UK revised DAQI

In the UK the Department for Environment, Food and Rural Affairs (DEFRA) publishes since 2013 the revised Daily Air Quality Index (DAQI); the first DAQI was introduced in 2012. The DAQI has 4 quality levels (from best to worst: LOW, MODERATE, HIGH, VERY HIGH) and the index runs from 1 to 10. It is based on concentrations of O3, NO2, SO2 and PM’s (PM10 and PM2.5) measured in ug/m3 (CO has been removed in the revised DAQI).

The following table gives the break-points (link):

The first comment should be that the “band” qualifiers correspond to the numerical index, and that “Low” means low index = good air quality conditions. The break-points are not proportional to the concentration: note that for O3 index 2 spans over 33 ug/m3, whereas that index 4 extends over 20 ug/m3. The pollutant with the highest index defines the published DAQI.

Ozone concentrations are only taken as 8h running mean. The color levels used for the different bands and subdivisions are different from those of EPA and China, and the health messages attached reflect the differences between individuals at risk and the general population:

There are at least two methods to view live DAQI data:

1. use a Google Earth KMZ file (link)

2. go to the interactive map (link):

Clicking on a station gives very detailed information, a shown below (all lines are active links):

Conclusion:

  • Care should be taken to not confuse a “LOW” index with “low air quality”.
  • Not further subdividing the “Very high” category is a good decision.
  • 10 different color-shades are in my opinion way too many: it is difficult to distinguish neighboring colors when the map is shown in a poorer resolution.


7. The French ATMO index

The “Fédération des Associations de la Surveillance de la Qualité de l’Air” (link) defines two indices:
– the ATMO is based on 4 pollutants (O3, NO2, SO2, PM10) and applicable for cities of more than 100000 inhabitants
– the IQA (Indice de Qualité de l’Air simplifié) is based on a subset of these 4 pollutants and used for cities with less than 100000 inhabitants

In the following, I will consider only the ATMO which extends from 1 to 10, uses 6 quality levels and only 3 different colors (GREEN, ORANGE, RED) as defined in the relevant “arrêté” (link). The break-points are based on 1h concentrations measured in ug/m3 (except PM10 given as the 24h mean); if several stations cover a geographic zone, the average is used. As for all previous indices, the highest sub-index defines the ATMO (link):

I did not find an interactive map covering France, but you may start here with the map of the regions (link) and click on a region to get more details, as shown for the Eastern Region of France (link):

The details in the regional maps vary from region to region; in the sub-map above clicking on a station gives further specific indices for the individual pollutants.

Conclusion:

  • using only 3 colors makes an overall view easier
  • the format for the individual regions is not exactly the same, which is slightly annoying. Besides the ATMO France often uses an AQI called CiteAir, which is based on a EU convention. The EU AQI’s will be discussed in the upcoming part 4.

(go to part 4)


AQI: air quality confusion (2)

May 21, 2018

This is part 2.
Click on the links below
for the other parts.

Part 1, 3, 4, 5.


In the first part of this blog on AQI I finished with the definition of the US EPA AQI, which has 6 quality levels and AQI numbers of to 500. Before going to Europe, let us begin this part with the Chinese AQI.


5. The PRC Chinese AQI

China uses for defining air quality the same 6 pollutants as does the US EPA (see here): O3, NO2, PM10 and PM2.5, CO and SO2. It also uses 6 quality levels albeit with different wording: EXCELLENT to SEVERELY POLLUTED. The Chinese sub-AQI’s (called IAQI = individual AQI) run from 0 to 500, as do the EPA sub-AQI’s. And the highest IAQI defines the published AQI. Most of the times PM2.5 is the primary pollutant with the highest IAQI, but during summer time O3 may have the highest IAQI.

The break-points for PM’s differ from those of EPA (link, attention: this blog has a completely wrong table comparing US and China other AQI’s):

The qualifiers (“Description”) in this table are the Chinese ones, and obviously China is much more tolerant for PM2.5 as is the EPA (notice that the first Chinese break-points are considerably higher). The same remark holds for some of the other pollutants as shown in this comparison table which uses 1996 EPA break-points (link):

First one should note that China uses ug/m3 as concentration unit. Second it calculates NO2 pollution only using a 24h average, whereas EPA uses 1h values, which makes comparison impossible. Third where comparison can be made, the break-point numbers are very close for O3, CO and PM10 but differ for SO2 (24h), NO2 (24h) and PM2.5 (24h).

Chinese AQI’s are often calculated as the average from readings of multiple stations around a city, whereas US EPA AQI’s allways come from a single station.

The US Embassies in China have their own measuring stations which use the EPA standard: see here.

There are a couple of smartphone apps to visualize real-time Chinese AQI’s, but I did not find an official Chinese live map on the web based on Chinese AQI standards. The waqi.info web site shows Chinese air quality using EPA standards; the same holds for the website aqicn.org.

The next picture shows the situation today 21 May 2018 at 14:10 UTC:

Clicking on a label gives more information, as for instance for the City of Yulin:

We see that PM2.5 and PM10 situation is particularly bad, whereas O3 and NO2 levels are GOOD.

Comparing AQI’s over China with those of other parts of the world clearly shows that bad air quality (mostly PM’s) is a serious issue in many parts of mainland China.

Conclusion:

Be careful when reading AQI’s for China, as often it is not clear on what standard they are based. The following paragraph (link) summarizes this well:

(go to part 3)


AQI: air quality confusion (1)

May 20, 2018

This is part 1.
Click on the links below for the other parts.

Part 2, 3, 4, 5.


Luxembourg’s Environmental Agency has joined the AQI-train and published a smartphone app called “Meng Loft” (= my Air) which gives an air quality index (AQI) for Luxembourg and/or sub-regions of the country. There are many different AQI’s around the world, and in this multi-part comment I try to clarify a bit the overwhelming number of country/administration specific definitions.


1. What’s an index?

An index is a single number which should simplify a more complex situation. A good example is the UV-Index (UVI) which represents by a single number (in practice between 0 and about 12) the “dangerosity” of solar UVB irradiance. The biological effect of UVB is expressed as a dose intensity in the biological effective unit MED/h (minimum erythemal dose per hour). A person of a certain skin complexion (phototype II) is assumed to have a reddening of the skin (an erythema) after having received this dose. Physically speaking the dose represents an energy (a number of Joule per m2), and the instruments measuring UVB measure a dose per time unit: our UVB Solarlight biometer at meteoLCD measures MED/h per m2. The UVI is defined as a biologically effective UVB irradiance of 25mW/m2 where UVB extents to wavelengths between 298 and 320 nm. So here we have an index that represents simply a scale-factor for the physical unit: the UVI is strictly proportional to the physical unit of the relevant phenomenon.

2. What’s air quality?

The air we inhale is a mixture of many components, where some are considered as potentially harmful above a certain level (or concentration). The three core “pollutants” are ground ozone (O3), nitrogen dioxide (NO2) and fine particles (PM10, PM2.5). Please note that all theses substances exist in every type of air and have both natural and anthropogenic origins. So the qualifier “pollutant” is slightly misleading: theses substances should be seen as “pollutants” if their concentration exceeds certain levels. Besides these 3 core substances many others are often considered, mainly CO, SO2 and NO etc…

One real problem is the measurement of theses substances and the units used. O3 for instance is measured by the big expensive sensors by its absorption of certain UVB wavelengths (e.g. our previous O341M sensor by Environnement SA); other sensors use chemical reactions that change an electrical current (amperometric sensors as our CAIRSENS) and so on. The concentration of O3 and NO2 can be expressed as a sub-volume in a reference volume (usually in ppb =parts per volume) or as a mass in a reference volume (microgram per m3 = ug/m3). The big advantage of the ppb unit is that it is independent of ambient pressure and temperature; the big disadvantage of the ug/m3 unit is that it depends on a standard pressure (1013.25 hPa) and a standard temperature (usually 25°C, but also 20°C). Many countries like the USA use the ppb (or ppm), but the EU has decided to use the ug/m3 unit. As the standard temperature for gases in the EU is often taken as 20°C (but frquently also as 25°C) there is much room for confusion. The conversion factors from ppb to ug/m3 are the following (see here):

O3:    to change ppb to ug/m3 multiply by 1.996 if standard temp. is 20°C and by 1.962 if standard temp. is 25°C

NO2: to change ppb to ug/m3 multiply by 1.913 if standard temp. is 20°C and by 1.880 if standard temp. is 25°C

The concentration of fine particles (PM10, PM2.5) is universally given as mass per volume (ug/m3). PM10 are particles up to a size of 10 micrometers, PM2.5 up to 2.5 um. On-line measurement principles are either the attenuation of beta radiation or the scattering of light (laser light); these techniques all must be done in known gas conditions and dry air (measurement with new low-cost sensors as the Nova SDS011 give absolutely wrong results outside a very narrow humidity range). PM2.5 are much more difficult to measure so that many stations keep to PM10’s.

3. Not one but many AQI’s

Every pollutant has its own AQI, and usually it is defined by a “break-point” table relating concentration to this AQI. The resulting graph is a polygone, so that over its full range there is no proportionality between concentration and AQI. The numerical range of the AQI varies enormously from country to country: for instance 0-500 in the US and 0-100 in many EU countries. This numerical range is divided into quality levels (e.g. Excellent to Hazardous) and the number of these levels and the precise wording also is not standardized.

But how to you define a single AQI out of an ensemble of for instance 3 core pollutants? Here the methodology is the same everywhere on the world: the defining AQI is the highest sub-AQI. An example: if O3-AQI = 80, NO2-AQI = 60 and PM10-AQI =50 then the published AQI is 80. This definition often leads to difficult to understand results. If O3 levels are normally high at a pure air mountainous station, but NO2 and PM levels low, that station may be qualified as poorer than a city with slightly lower O3 but much higher NO2 and PM concentrations.

4. The EPA AQI

Let us start with the US EPA (Environmental Protection Agency) AQI, as defined in the last revision. Here is the “break-point” table which defines the specific “sub-AQI’s” for the different pollutants considered by the EPA ( in yellow the 3 core pollutants):

To approximately convert either O3 or NO2 to ug/m3, use a multiplier of 2.

A first problem is that lower 1 hour O3 levels do not have an EPA AQI, what is unfortunate because usually all measurement stations give at least one measurement per hour. To simplify let us take break-points 0…62 and 63…124 for the O3 1h series. Clearly the steps corresponding to the concentration are not of the same magnitude: an AQI [0…50] corresponds to concentrations [0…54 ppb] whereas the same AQI step of 50 [1001…150] corresponds to [125…164 ppb], a much lower concentration increase . The graphical representation is a polygon: there is a proportionality between concentration and AQI from one break-point to the next, but no proportionality from 0 to maximum concentration as shown in the next graph (the red line is a calculated trend-line with its equation to show the deviation with the polygon):

The EPA AQI has 6 quality levels, from GOOD to HAZARDOUS, and runs from 0 to 500. Many on-line sites give a real-time view of the EPA AQI for the entire world, the local measurements being converted according to the EPA standard:

The following figure shows the situation given by http://waqi.info today:

Zooming into the figure allows to inspect individual stations and the time series of the last two days.

The quality levels of EPA are relatively “generous”: an 8h O3 concentration of 100 ug/m3 still qualifies as GOOD, whereas in Luxembourg is runs under “MEDIUM”.

(to be continued)

Click here for part 2