Archive for April, 2016

First Radiation Amplification factor for 2016

April 21, 2016

In several previous posts (here and here) I commented on the RAF (Radiation Amplification Factor) which tells us how much a change in the total ozone column will cause a change in UVB irradiation. The question is usually asked to quantify the danger that a thinning ozone layer will cause an increase in UVB radiation which might cause an increase in skin cancer risk. The often extremist scare on the danger of UVB radiation has faded somehow in the last years, as cases of rickets caused by too few UVB exposure has again shown up (read this paper). But at many beaches, you can see overprotective mothers putting their children in UV filtering jump-suits, which might be an overreaction triggered by the scary media stories, which usually start in Western countries at the first warm and sunny days of the year.

The RAF is defined as: RAF = – [ln(DU2/DU1)/ln(UVB2/UVB1)]

where the indices 1 and 2 correspond to two different situations. The following graph shows the situation today, a second (nearly) blue sky day following the first. As these dates and the time of measurements are so close, we may assume a constant length for the sun rays through the atmosphere, and constant attenuations. The AOT (atmospheric optical thickness) which measures the turpitude of the atmosphere was 0.055 the first day and 0.068 the second day; these are very close values. For comparison the AOT was 2.197 on the 19 April, which had a heavy cloud cover. The solar zenith angles where 38.4 resp. 38.0 degrees.

RAF_20_21April2016

With the readings shown on the graph, we find an RAF = 1.10

In a much a much more extensive paper I wrote in April 2013, the corresponding value is 1.08 (computed over 5 consecutive days).

Expressed as simple percentages one can roughly say that during the two days of 20 and 21 April 2016 a decrease of 5% of the total ozone column caused a rise of the UVI of 9% (percentages w.r. to the first day). Beware to not extrapolate linearly this conclusion, as the RAF is defined by non-linear logarithms!

______________________________________________________

27 Sep 2018>  correction of the RAF formula
 

European Summer Temperatures since Roman Times

April 9, 2016

J. Luterbacher from the University of Giessen has published in Environmental Research Letters an interesting paper on the evolution of European summer temperatures. The paper is only 12 pages long, but the long list of coauthors counts 44 coauthors, reflecting the inflationary tendency to cite everyone the author will be agreeable too (and the desperate struggle for scientists to be coauthor for a maximum of papers). Nevertheless, the paper is interesting to read.

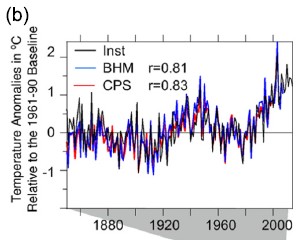
The authors used two statistical methods to evaluate temperature proxies (here tree-rings): a Bayesian hierarchical modelling (BHM) and a Composite Plus Scaling method (CPS). Both results are compared (where feasible) with instrumentals records (here Crutem4). The concordance of these 2 methods and the instrumental record is rather good, as shown in this figure which gives correlations r of 0.81 and 0.83.

Luterbach_Instruments_B_C

Are the 20th century summer temperatures unusual?

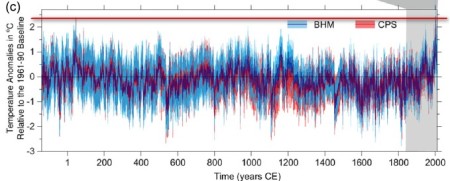
A comparison from Roman times to today is known to include 3 warm periods: the Roman, the Medieval and the Modern (notice the well-known ~1000 year period!). The next figure shows the results given by the two statistics and the IPCC consensus reconstruction:

Luterbach_B_C

I have added the red horizontal line giving the highest (reconstructed) level of the Roman Warm Period: clearly the situation during the 20th century was not unusual compared to this period.

Another figure starts at the Medieval Warm Period and gives the same impression:

Luterbach_MCA_LIA_PresentCompared to the Medieval times, the last 100 years with noticeably higher atmospheric CO2 concentrations (mixing ratios) do not show a dramatic warming!

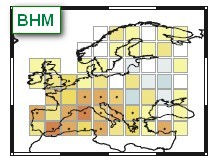
A last figure is also very telling: it gives the temperature differences between Present (1950 to 2003) and Medieval Warm Period:

Luterbach_Present-MCA

Luterbach_Present-MCA_scale Some locations close to the Mediterranean are warmer, most only slightly warmer or about the same and two even cooler.

Conclusion:

The authors write that “both CPS and BHM  indicate that the mean 20th century European summer temperature was not significantly different from some earlier centuries, including the 1st, 2nd, 8th and 10th centuries CE”.

This would be the last word, but we all know that a scientist today must pay at least lip-service to the global warming meme. Accordingly the authors tell us that “However, summer temperatures during the last 30 yr (1986–2015) have been anomalously high”. Remember that we had a “monster” El-Nino in 1998, and a very big one in 2015: these two events alone pushed up the average temperatures a lot, so this last remark is rather irrelevant.

But as they write in another part of their paper that “… as well
as a potentially greater role for solar forcing in driving
European summer temperatures than is currently present
in the CMIP5/PMIP3 simulations. This might be evidence for an enhanced sensitivity to solar forcing in this
particular region”, acknowledging the IPCC denied solar forcing, I will pardon the mandatory, career friendly and politically correct sentence on the last years.