I just finished the page with the data trends from 1998 to 2009 at Diekirch and found an interesting feature about solar irradiance. Starting 2004, all instruments measuring solar radiation (pyranometer, UVB and UVA sensors) show a negative trend (with a possible reversal during 2009).

Above is the graph of the solar energy dose on a horizontal plane in kWh per m2 and per year.

…and here the UVA dose measured by a Solar Light biometer.
Marcel Severijnen with whom I regularly have very interesting mailings sent me the data from the KNMI station (#380) of Maastricht, and here this negative trend can also be seen (albeit less pronounced than at Diekirch):

With the exception of the 1998 readings, mean annual solar energies follow the same pattern at Diekirch and at Maastricht. It would be interesting to find the cause for this dimming:
1. is it the weaker sun as solar cycle #23 comes to its end?
2. or is it the aerosol or AOT (atmospheric optical thickness = atmospheric turbidity) which seems again on the increase after many years of going down, as I showed in this paper.
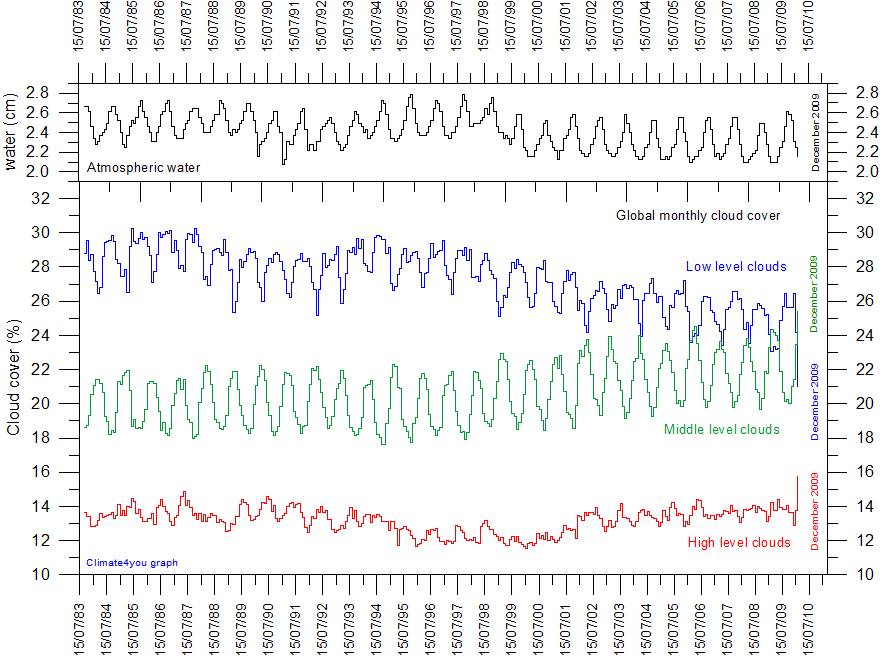
3. or is it a change in low cloud cover? This later explanation does not seem valid, as shown by the following graph from Prof. Ole Humlum’s excellent www.climate4you.com website:

Global low cloud cover (blue curve) seems to be on a negative trend since 1998 (click here for high quality graph).
But let’s not confuse regional and global data: the cloud cover over West Europe could well follow a different trend….
Have a look at this paper from C. Ruckstuhl et al: (link to AGU abstract, paper is paywalled): “How do aerosol histories affect solar “dimming” and “brightening” over Europe?: IPCC-AR4 models versus observations”. The same authors also have a new paper in press at GRL: Ruckstuhl, C., J. R. Norris and R. Philipona, 2009, Is there evidence for an aerosol indirect effect during the recent AOD decline in Europe?, J. Geophys. Res., accepted.
(to be continued, last edit 14Jan2010, 07:45 UTC)
________________________
continued 15Jan10:
If we compute the interval [mean -2*sigma, mean + 2*sigma] we get [10013.6 … 1214.8]. With the exception of year 2003 (the heatwave year) none does have values outside that range. The 95% confidence bands show that only the years 2002 and 2003 fall outside, i.e. differ in a statistically significant manner( see following figure). So the observed short-term negative trend is not significant, and remains compatible with the statistical (and natural) variability. For the Maastricht data, only 1998 (I have some doubts if this extraordinary low value is correct!) and 2003 fall outside.

Marcel finds about the same result when taking into account all measurements since 1964.
__________________________
Solar energy and sunshine hours.
The correlation between yearly total sunshine duration and solar energy is very good: for Diekirch R=0.93 (1998 to 2009) and SolarE = 713.9479+0.2402*Sunshine with SolarE in kWhm-2 and sunshine duration in hours. This means that for stations where solar energy data are not available, sunshine duration could be used as a proxy. I will make a new comparison using a station very close to Diekirch: the weatherstation of Trier-Petrisberg (WMO station no. 10609 ) located about 30 km from Diekirch, but at a marginally higher altitude of 234 m (versus 218 m for Diekirch; the WMO given altitude seems to be wrong). The DWD (= deutscher Wetterdienst) data can be found from this page).
Here is a graph with the yearly sunshine hours, including also the data of the weatherstation of the Luxembourg Findel airport (altitude 376 m, about 30km from Diekirch, WMO station 06590)

The extreme low 2004 value at Trier makes me scratching my head; I know that Findel uses a Campbell-Stokes instrument, and guess that Trier does the same. The Diekirch sunshine hours are computed from the irradiance data (using Oliviéri’s method). All linear trends are very close and suggest a shortening of sunshine duration of about 38 hours per year. When looking at the statistics, most data fall into the 95% confidence band.
Be it as it is, all these stations point to a sun starting dimming in 2004, with a reversal seen in 2009 which could well mark the end of this short episode of a weaker sun.

