Archive for July, 2021

Radioactivity and precipitation

July 27, 2021

In the past I have written many times on the observational fact that due to radon washout, the ambient gamma radiation shows sometimes impressive peaks ( see here, here, here, here, here, ).

In this blog I will show that the graphs of cumulative rainfall and gamma radiation might give a wrong picture, and that using the original time-series yield a more correct insight.

Here what the graphs of cumulative rainfall and gamma radiation of atmospheric air shows for the week covering the 24 and 25 July 2021:
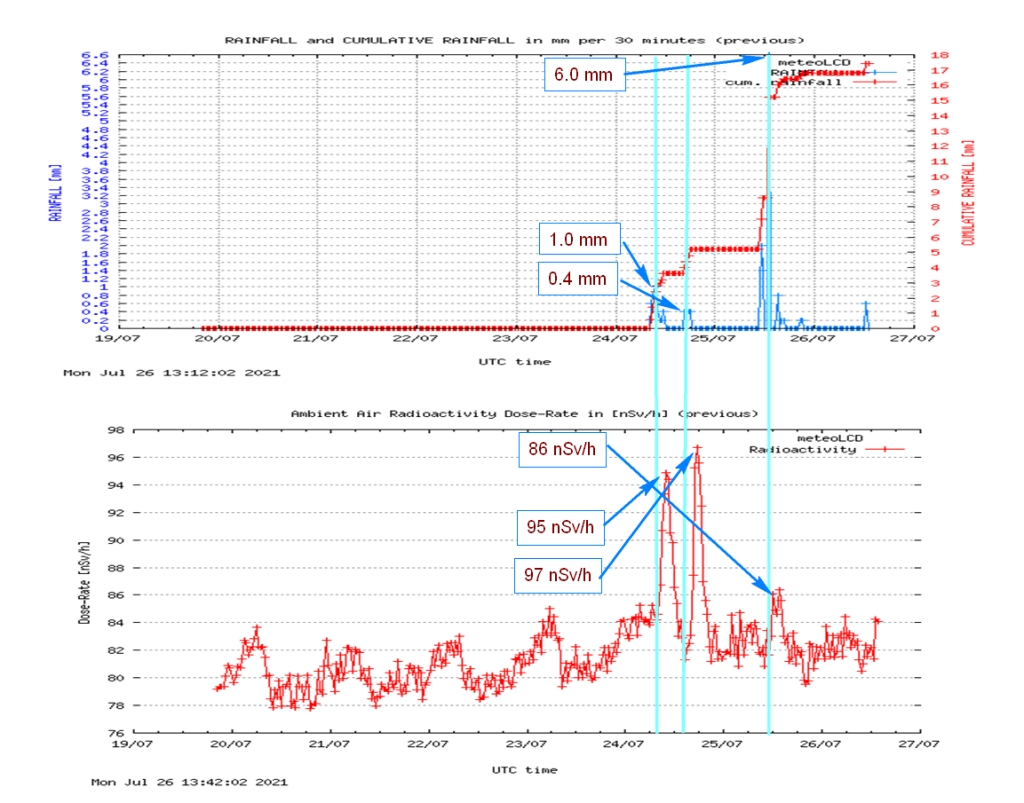
These graphs are not faulty, but give a wrong picture: the two rainfall peaks cause two radiation peaks, with the second higher that the first, even if its “cause” (= the precipitation in mm per half-hour) is much less. This could be a sign of radon washout during the first peak, and radioactivity levels which have not yet recovered to their usual background.The third precipitation peak during the 25th July does only cause a mild surge of the gamma radiation intensity.

Now let’s zoom on the half-hourly levels of precipitation and gamma radiation:
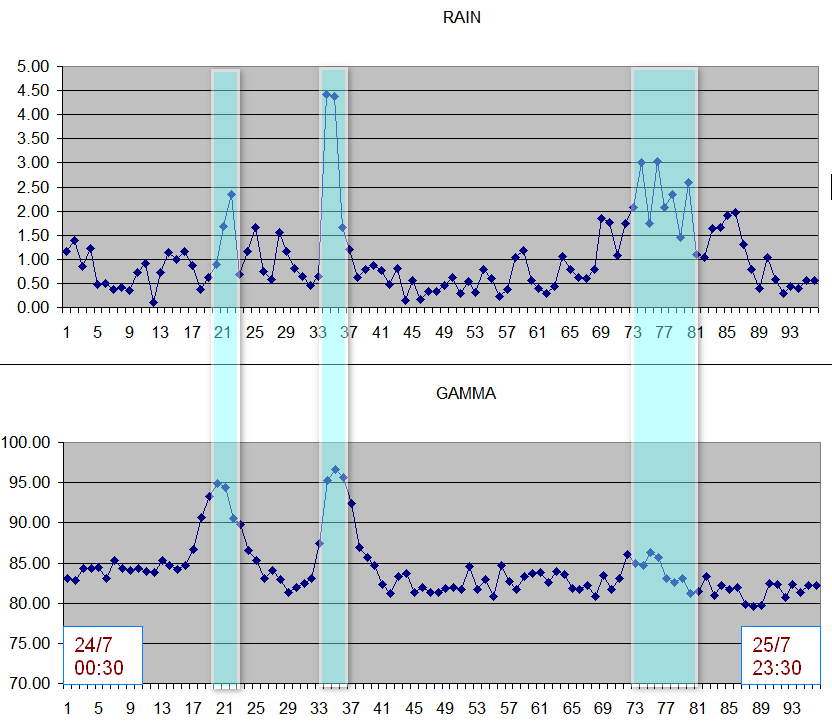
The picture becomes somewhat clearer: there are 2 precipitation peaks during the 24th July 2021, and the intensity of the second is close to the double of the first ( the X scale represent the multiples of half-hours, starting at 00:30). The second radiation peak is practically the same as the first: the gamma levels have not sufficiently recovered from the first washout during the approx. 7 hours to yield a proportional higher peak.

The third event during the 25th July is more “smeared out”: the total rain volume falls down during ca. 3.5 hours (7 half-hours), and is not concentrated on a single half-hour event. This does not cause a strong radiation increase, even after 20 hours have passed since the last rain-fall peak, a time-span probably long enough to compensate for the previous washout. I suggested in one of the previous blogs a recover period of approx. 1 day.

I always marvel why our “greens” have not yet discovered this natural phenomenon of radiation increase, and not jumped on this pattern which should give a good scare. The second peak here is about 97-85 = 12nSv/h, i.e. 14% higher than the usual background. What would Greenpeace say if radioactivity from the Cattenom nuclear facility had increased by this amount?
The declining value of wind and solar electricity

July 23, 2021

.

link

Many scientists have predicted that wind and PV electricity value will decline above a certain level of penetration, where penetration means the percentage of installed wind and solar capacity w.r. to the total installed electricity production systems (which include for instance fossil fuel and nuclear systems).

A new outstanding paper by Dev Millstein et al. published in JOULE (a CellPress Open Access publication) puts these predictions on solid data foundations. The title is “Solar and wind grid system value in the United States: The effect of transmission congestion, generation profiles and curtailment” (link). The authors analyzed data from 2100 US intermittent renewable electricity producers, and separated the influence of the production profile (e.g. the sun does not shine at night), transmission congestion (e.g. difficulties to transport excessive solar and wind electricity during favorable periods) and curtailment (i.e. cost of shutting down solar and wind producers to avoid net infrastructure problems).

This is a long 28 pages paper, well worth reading several times to become familiar with the different technical concepts.

In this blog, I try to condense the essentials in a few lines.

  1. By how much do the prices for wind and solar electricity fall ?

The short answer is that above 20% of wind/solar penetration, the produced electricity value falls by 30 to 40%.

This is an enormous amount, which may put a barrier to higher wind & solar penetration. This barrier is basically rooted in economic realities, not physics or engineering problems!

2. What is the parameter which has the most influence on value creep?

The authors find that the production profile i.e. the timing of production over a day or longer period is the principal cause of the fall in electricty value:

Look at the highlighted CAISO numbers, which correspond to the situation in California. The solar penetration is large (19%), as is the value fall of 37% ( the is percentage of value decline w.r. to electricity prices which would have been customary when there were no intermittent wind & solar renewable producers).

For most sites, the decline of electricity value follows a logistic curve ( = exponential decline at the beginning which stabilizes at an horizontal asymptote). This is not the case for CAISO, where the decline is practically linear (see the yellow double-line, highlights by me):

The decline from 0 to 20% penetration is nearly 50%, from about 1.3 to 0.6, which is close to breathtaking!

3. What do we have to expect?

Up to now, most of this decline was cancelled or obscured by the falling prices of wind and solar installations. But many factors suggest that the easy part of lowering prices to make PV’s and wind turbines is bygone. There surely will be some fall in prices, but not at the level previously seen. The scarcity of raw materials and rare earths, the low number of producing countries and regions, the increased world-wide demand all point to an end of the spectacular price falls seen during the last years.

So in absence of a breakthrough in storage technology which could change the production profile (remember: this is the main factor of the fall of electricity prices!), some countries will rapidly hit the wall. Sure, politics and overt or hidden subsidies for wind & solar may obscure this price creep, but these will inflate electricity prices above levels that even the most green-inclined citizens are willing to pay. Knowing that their sacrifices will have no measurable influence on supposed global evil climate destructive CO2 levels will certainly be a barrier for increasing sacrifices in life-style, which are asked for, and by this value decline in wind & solar electricity that should save the planet.

4. Some conclusions of the authors

  • Some models indicate …. that value decline might soon get worse; our empirical values provide little solace on that front
  • Forward-looking models, which have been roughly correct to date, suggest that we will soon enter a regime of accelerating value decline

All this should somehow dampen the naïve and “politically correct” enthusiasm for an exclusively wind and solar driven world!