Global temperatures from historic documents (2/2)
3. Into the Kramm paper
In this 2nd and last chapter we will look into subsets of the Kramm et al. paper, leaving out all mathematics and concentrating on the essential message.
First a comparison of global temperatures from 1881-1910 as found by the ancient authors and the modern 3 groups:
von Hann (1897): 14.2 °C (as edited by Kramm et al.)
HadCrut4: 13.6 °C
Berkeley: 13.5 °C
Nasa GISS: 13.6 °C
So clearly these temperatures corresponding to times where human CO2 emissions were still very low show that the “modern” groups propose distinctly lower temperatures than the historic documents do.
If we look at the 1991 – 2018 period, the latter 3 groups give 14.4, 14.5 and 14.5 °C. This means that according to “modern” groups the Earth has warmed by about 0.8 to 1.0 °C, whereas the historic documents suggest at most 0.3 °C warming, a negligible amount.
Kramm et al. cite a research by PaiMazumber and Mölders (2009) that tried to quantify the impact of meteorological network density and locations of the measuring stations, using data from Russia. The conclusion was that the real existing network overestimates real ground temperatures at 2m by as much as 1.9°C ! Numbers as this must to be kept in mind when reading scary papers talking about near-catastrophic 2 °C global temperatures increase.
The ancient authors often calculated the global hemispheric zonal temperatures under 2 extreme hypothesis: the hemisphere is covered only by water, and at the other extreme, it is covered only by land. Forbes proposed in 1859 the following formula to calculate the exact zonal temperature for latitudes that were covered as well by sea as by land:
T(lat) = A + B*[cos(lat)]^m + C*n*cos(2*lat)
where n = fractional landcover (0 … 1)
The parameters A, B and m were empirically calculated for the Northern Hemisphere as A=-10.8, B=32.9, C=21.2 and the exponent m=1.25.
If we take the latitude of Diekirch as approx. 50° and the land-cover fraction of this latitude as 0.56, this historic formula gives 6.08 °C, much too low as the above mentioned local value of 10.6°C, but practically identical to what D. RIND found in a paper published in 1998 for the latitudinal average (link):
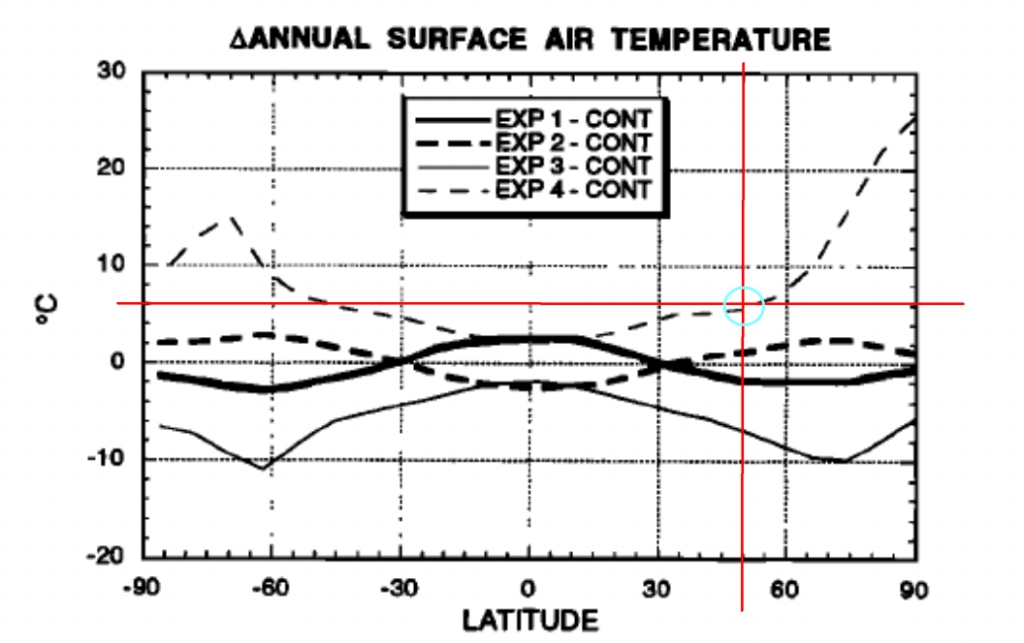
This example shows that the historic results have value, and cannot simply be dismissed or ignored.
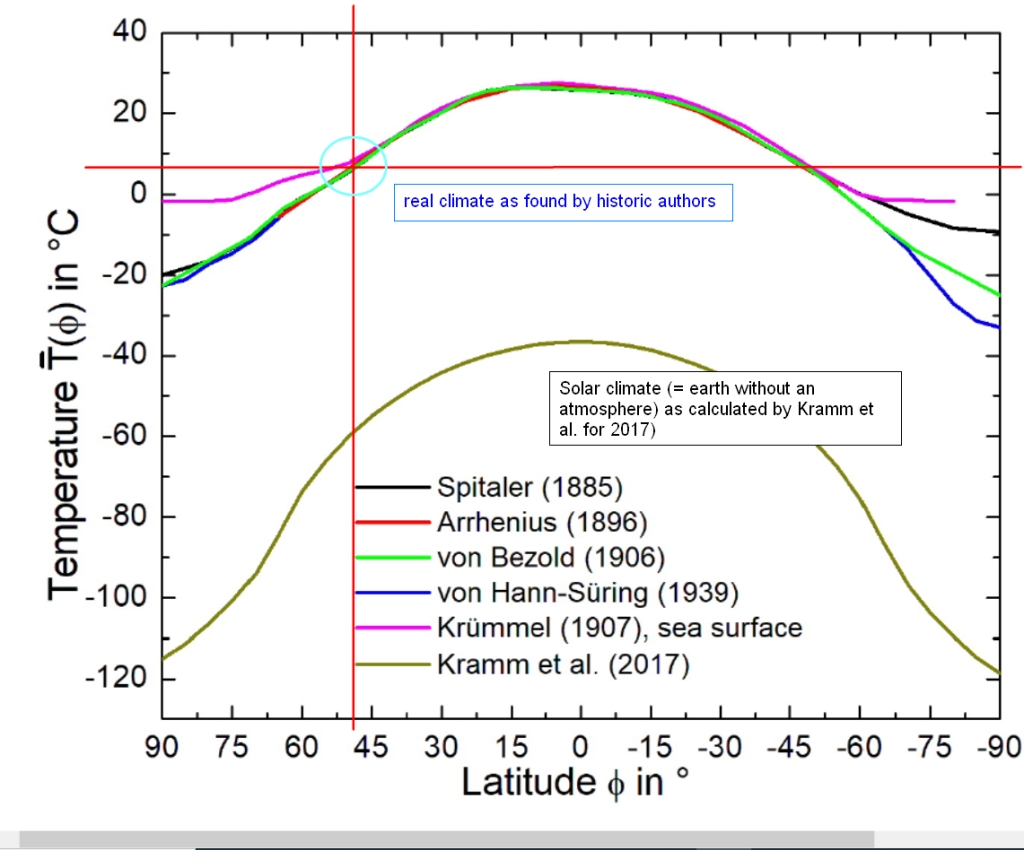
The next figure shows the same result for 4 different authors, and the zonal temperatures for a globe without atmosphere as calculated by von Kramm. Here again, the 4 authors find practically identical results ( 50° latitude marked by red lines and blue circle):
4. Conclusion
The points shown above suggest not to ignore historic datasets and calculations. Most of these give zonal yearly average temperatures at the end of the 19th century that are distinctly higher than those of the “modern” groups like HadCrut4, Nasa GISS and Berkeley BEST, and as a consequence suggest a global warming for the last century that is much lower than the consensus value.
The most important conclusion is given by the authors as follows: ” the results derived from historical data suggest no change in the globally averaged near-surface temperatures over the past 100 years”.
This conclusion seems to me like a devastating bomb dropped into the fashionable modern consensus climatology. Have you read about this? Probably not…
Please make up your mind !
