Archive for February, 2013

Brunnengräber report: Klimaskeptiker in Deutschland

February 24, 2013

klimaskeptiker_in_Deutschland

This is a new report (in German) from the University  of Wien (Austria), which has been discussed by Pierre Gosselin in this blog Notrickszone. The 60 page report is written with the support of 5 institutions:

Klimaskeptiker_in_DE_beteiligteInstitutionen

You should notice the presence of a catholic theological private university, which is a clear sign that the climate discussion mixes religious feelings with science and politics.
I read the 60 pages report carefully and have very mixed feelings. It certainly does not confer a Nobel price, but it has the merit to clearly stress and define the diversity and the common beliefs of the climate realists community. Over large parts, these descriptions are given in neutral and not (too visible) polemic terms, but later on the report rapidly falls back into the downs of the most primitive suggestive wording and one-sided views.

A very annoying, really childish obsession is the feminization of  professions: you have the “AkteurInnen”, the “WissentschaftlerInnen”, the “NobelpreisträgerInnen”, the “PolitikerInnenreden” etc… How pity full and laughable is this German politically correct prose, written by a supposed adult university professor who is a Privatdozent of the FU Berlin)! It should be noted that this report is the result of a funding by the Climate and Energy Fund of the Federal State (“managed by Kommunalkredit Public Consulting GmbH, Laufzeit: 01.03.2012 – 31.12.2013″), so the insistence in the report that climate skeptics receive various funding could backfire!

At page 16 the author writes: “Allerdings gibt es auch und diese Gruppe dürfte in der deutlichen Mehrheit sein die Klimaskeptiker, die den menschenverursachten Klimawandel durchaus als wissenschaftlich erwiesenen Tatbestand anerkennen, aber den daraus resultierenden Katastrophismus oder die Klimahysterie ablehnen” . This is an example of what I said about neutrality, and this kind of wording should be the norm in an academic-level report.

Now compare this with page 33: “Dies sind Anknüpfungspunkte für Klimaskeptiker, um Unsicherheiten zu verstärken, Desinformationen zu verbreiten…“. Here the author clearly considers climate skeptics as people who publish disinformation: good climatologists publish information, climate realists disinformation! Say farewell to neutrality, the report is sliding down into diatribe and cheap defamation!

On the same page, Brunnengräber writes how hockey-stick author Michael Mann writes on him being attacked by the climate skeptics… but not a single word on how the hockey-stick team did it’s best to block all publication that they thought “not conform”.

The author also falls into the trap of suggesting that climate skeptics do not publish in peer-reviewed papers, voluntarily ignoring the vast amount of scientific publications… is this due to non-excusable laziness or an “a priori” agenda ? It should be noted that this report received funding over a 10 months period, from 01 March to 31 December 2012.

Suggesting the work of Prof. Mangini from the University of Heidelberg (an eminent specialist of stalagmite use as a temperature proxy) Brunnengräber writes: ” Oder es wird auf nationale Klimaforschungsinstitute Bezug genommen, die wenig bekannt sind, aber mit eigenen Forschungen mit Eisbohrkernen aus der Antarktis, mit Stalagmiten-Analysen oder langjährigen Wetteraufzeichnungen aufwarten ” (pp. 26/27, bold emphasis by me). I do not think that Prof. Mangini’s “Institute of Environmental Physics” is little known, and that the condescending term of “aufwarten” is the correct wording to describe the exceptional work done there  in stalagmite datation.

The German EIKE (Europäisches Institut für Klima und Energie) comes out as the most dangerous villain German  organization. The author writes on its finances: “ finanziert sich (angeblich) nur durch private Spender..” Why the doubt seeding term of “angeblich” = alleged ? If the author is not sure about the private funding, he should have done his research properly, but he didn’t!
The next important enemies clearly are Fritz Vahrenholt and Sebastian Lüning, the authors of the “Die kalte Sonne“, a book that had the impact of a small atomic bomb in Germany! And in the camp of the “bad” journalists, no surprise, you find Dirk Maxeiner and Michael Miersch  which are even labeled industry-lobbyists! Did Brunnengräber even read one single of the truly excellent books of this team?

Conclusion:

The report has been written by a professor of the (leftist) “Forschungszentrum für Umweltpolitik” of the FU-Berlin, and a quick glance at the publications of that institute shows it’s agenda and ideology, and what probably is expected from its members. It is a pity that a report which could have been a possible and valid scientific contribution to the climate debate, has been badly disfigured by the agenda and let’s say it clearly, the one-sided and insufficient research work of its author. I nevertheless suggest you take the time to read it through, and make out your own opinion.

And you climate realists, please take consolation with this old (and  slightly modified) German dictum: “Wer andern einen Brunnengräb(er)t, fällt selbst hinein“.

Bad wind, lower wind power, exploding costs!

February 17, 2013

Abstract:

1. Average wind speed is on decline at meteoLCD, and probably also at large parts of neighboring countries
2. As a consequence German and Luxembourg  wind-energy production is hampered by declining capacity factors
3. Nevertheless, the huge windpower capacity installed, together with an inadequate grid and nearly nonexistent storage facilities, makes that the cost for downing wind parks rises exponentially in Germany.

_____________________

1. Declining wind speed

In a previous blog I commented on the declining capacity factor of the Irish Eirgrid’s wind turbines, taken as a whole. The same holds for Germany and Luxembourg, at least from 2007/8 on. The German wind power association recently acknowledged that despite more than 1000 supplementary wind turbines being installed in 2012, the total energy output was less than that of the previous year (45.9 versus 46.5 TWh). The culprit is declining wind speed.
I  checked this wind speed trend on the meteoLCD data, starting in 2002 because since that date all equipment was the same and did not move.
airspeed_trend_2002_2012
fig. 1  Trends in mean yearly air speed at meteoLCD, Diekirch

The data points represent the yearly mean air speed measured by a cup anemometer. There clearly is a first period of positive trend, with a decline starting in 2007. I fitted two regression lines forced to meet at the year 2007 point; the decline after 2007 is an average of 0.06 m/s par year. In 2007, a “virtual” wind turbine installed at the same place of the anemometer would have delivered an energy proportional to v**3,  i.e. E0 = k*2**3 = k*8. The next year that energy would be E1= k*1.94**3 = k*7.30. So the first year decline would have been (0.7/8)*100 = 8.25 % or close to 44% during the 5 years following 2007 !

The airspeed decline is not correlated to the North Atlantic Oscillation; the correlation factor between the annual mean NAO index (station based) and airspeed is R = 0.24 and is not statistically significant.

________________
Comment added 19th Feb 2013:
There is a paper by Zhao et al (Advances in Climate Research (2) 4, 2011) which gives a declining trend for Europe of -0.09 ms-1 per decade for the 30 years period 1979 to 2008. The meteoLCD negative trend is nearly 7 times higher

________________

2. The changing capacity factors CF of national wind parks

To analyze the real situation, I digged into some data bases (for instance the  www.ieawind.org , www.ewea.org , fee.asso.fr websites, using wikipedia only as a last resort; the numbers are close, but not quite the same). I calculated the yearly mean CF from the yearly total production and the installed wind power at the end of the year. There is a small problem with this, as the installed wind power usually increases during that year, so dividing by the end-of-the-year installed power lowers the real CF a bit. In general, the difference is small, so we will live with this.

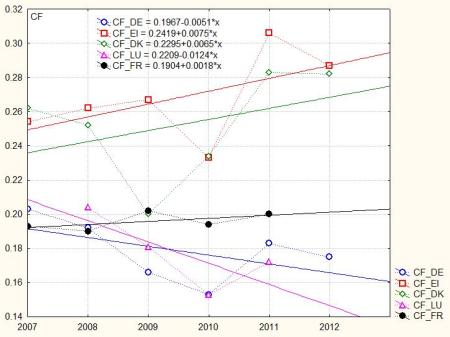
The next figure shows the situation for 5 countries: Germany (DE), Ireland (EI), Denmark (DK), France (FR), Luxembourg (LU)

CF_DE_Eire_DK_LU_FR

fig.2: Annual mean capacity factors of national wind parks

Clearly the German CF’s (blue circles) and the Luxembourg CF’s (pink triangles) are declining since 2007. The next figure computes the regression lines starting in 2007.

CF_DE_Eire_DK_LU_FRa

fig.3. Linear trends of annual mean capacity factors

Both Germany and Luxembourg show visible declining trends: Germany’s CF declines by 0.0051 per year, i.e. by 2.5% with respect to 2007, or a total (derived from the trend) of -12.6%. Luxembourg’s decline is even more spectacular (the 2012 data are not yet available):  CF declines by 0.0124 per year i.e. by approx. 6% per year (w.r. to 2008) or -24% for the whole period.
Neither of  these countries had by the end of 2011 a big offshore contribution (percentages of offshore installed power: DE = 0.3, DK =0.1,  EI = 1.5, all others 0%). Nevertheless it is clear that relative flat countries close to the sea as Denmark and Ireland fare much better than the “more continental” ones..

3. The German “Abregelung”

Despite declining capacity factor and energy production from wind turbines, the yearly  total of wind energy that has to be destroyed in Germany rises in a spectacular manner. The German word for this destruction is a harmless sounding “Abregelung”, translated to “down-regulation”. In fact, this word corresponds to the power that must not be produced to avoid a breakdown of the electrical grid. The grid operators as Eon or Tennet must pay the wind park owners for this, and these sums end up inflating the final consumer price. Here are the numbers as found in the Ecofys report ” Abschätzung der Bedeutung des Einspeisemanagements

ecofys_abregelung_2009_2011fig.3. German wind generated electrical energy destroyed and compensations paid.

Taking the solid blue triangle data points from the Bundesnetzagentur (BNetzA) one can see that the costs rise from about 6 million to 40 million Euro in the 3 years 2009 to 2011; this is an exponential increase that will continue as long as the deficient grid can not cope with increasing high wind production when local demand is low:

abregelungskosten_2009_2011

fig.4. Annual costs in million Euro  for downing wind production in Germany

The real costs for the customer are still higher, as a not negligible part of the energy produced has to be sold at zero or negative prices. For instance during 2012, electricity prices became negative 15 times at the Leipzig EEX exchange, reaching an eye watering -473 Eur/MWh at Christmas day 2012 in the morning. The total cost for the 2 successive days 25/26 Dec 2012 with negative price balance is approx. 75 million Euro. So it does not come as a surprise that German electricity is among the most expensive in the EU for the normal household paying the full tariff (about 29 cent/kWh in 2013, to be compared to the French tariff of  15.6 cent/kWh).

Without being a tenacious opponent to wind power, one has to ask the question how a nation of excellent engineers and scientists became so enthralled in “green” energy that they forgot two essentials in their rush for new wind parks: grid adequacy and storage facilities.

To blend or not to blend, that is the question!

February 12, 2013

The big ECAD site of the European Climate Assessment & Dataset holds two versions of data files: a non-blended and a blended one. The non-blended files are said to simply contain the raw data as submitted by the meteorological station, with -9999 indicating missing or unacceptable bad values (there is a column with a quality code, which is 0 if the data are ok and for instance 9 if the data are missing). The blended series fill in missing data by including measurements from realtime SYNOP messages broadcast continuously; in this in-filling only data from station not further than 12.5 km should be used.
Now, what does this mean in practice? I made some detective work using the TN and TX (= minimum and maximum daily temperatures) data files of daily measurements done at the Findel airport meteorological station. As said in a previous blog the FINDEL series have many missing days in 2011 ( the first 5 months are totally missing) and in 2012 (September is missing). Mr. Jacques Zimmer from MeteoLUX (the organisation running the meteorological FINDEL station) kindly told me that the problem was not non-existent measurements, but long-time and intermittent software problems with the transmission of the data to the official European collector.

1. Differences between the ECAD TN and TX non-blended and blended long-time series

The files with the TN and TX data are best found from the ECA&D website by following the links “Daily data” … “Custom Search” and entering Luxembourg and Luxembourg Airport. Both type of files start the 01 January 1947 and end the 31 December 2012. A quick glance directly shows the huge gaps in the non-blended versions during 2011 and 2012, but it is not clear how many differences exist during the previous years from 1947 to 2010.  To make an easy comparison of the text files, I used the excellent freeware ExamDiff  from Prestosoft.
Well, the result comes as a surprise: from 1947 to 2010 included, non-blended and blended files are exactly the same. The versions differ only during the last 2 years (2011 and 2012): most (but not all) of the missing data have been filled-in. Nevertheless, there remain 7 days flagged -9999  (01 to 03 January, 06 Mar,03 Apr and 18 May). I do not understand why these few holes have not been filled in!

Now a serious question is this: Can one reasonably assume that during the whole period 1947 to 2010 there have been no missing raw data in the FINDEL series? I think no, one can not! The conclusion is that after some delay (let’s say two years), the originally raw data have disappeared, and even series flagged as “raw” (as does the KNMI Climate Explorer which leads to the same files) are in fact modified series. So any hope going back to the “originals” for data re-evaluation is doomed.

2. Influence of blending on Findel mean yearly DTR

If we use the year 2011, we find the following:

– average DTR using the Jan. to May data sent by Mr.Jacques Zimmer and the non-blended series for the remaining of the year:  DTRavg = 8.12  (8.122740)

-average DTR using the blended ECAD series  (which still contain 7 missing days): DTRavg = 7.92  (7.922409)

The abs0lute difference is 0.30 °C, the blended value being 3.8% lower, a not negligible difference.

Using only the blended files for the 2002 to 2012 DTR anomalies (w.r. to the 2002-2011 mean) one finds a negative trend of -0.34 °C per decade. Using non-blended data (with the exception of in filling the missing September 2012 days by the blended data), the trend is -0.27°C per decade.

The following picture resumes the comparison, including the BEST DTR anomalies (up to 2011); it should be noted that BEST gives only mean monthly DTR, and not daily values as does ECAD; so the BEST points represent yearly averages computed from monthly means, whereas the meteoLCD (green points) and FINDEL (red and pink points) represent yearly averages computed from daily values.

DTR_compare_2002_2012

The picture shown in the previous blog showed a slightly positive trend for FINDEL; the reason is that I replaced the missing FINDEL data by those of meteoLCD, multiplied by a calibration factor. As a general rule,one should not expect DTR pattern being the same even for relatively close stations. The measured DTR represents the local climate, which can strongly diverge from a  pattern computed using data from neighboring stations, as does  BEST.

Marcel Severijnen, a regularly correspondent, also made in his blog klimaatblog.wordpress.com a comparison of DTR’s of some big and well-known stations Dutch weatherstations as de Bilt,  Maastricht, Vlissingen etc. He shows the following graph:

dtr-5-stations-nederland1

All these stations are less than 300 km apart, nevertheless show really different behavior: in-land station de Bilt could reflect the influence of a ~120 years double AMO related oscillation, whereas the damped oscillation of coastal Vlissingen seems close to the AMO period of ~60 years. Please read the full text (in Dutch) of Marcel’s comment here.

3. Conclusion

3.1.
It seems that the ECA&D non-blended files are in reality blended ones, except for the most recent years. Thus the raw data are lost in this big European dataset. This conclusion is preliminary, as based on a single station. A more stringent  analysis is badly needed.

3.2. DTR patterns of a station reflect the local micro-climate. They can be hugely different from those of other neighboring stations, and evidently from averages computed over extended regions.