About 15 km away from Diekirch, the small village of Larochette and some neighbouring villages sufferered the 22 July 2016 from a disastrous downpour of more than 50 mm during less than one hour: the result were very disruptive floods which caused much destruction: bridges that crumbled, roads torn open and many houses with their low levels flooded. The phenomenon was very localized, and in Diekirch the very short-lived rain pulse was not more than about 12.9 mm (in 30 minutes).
As seen in a couple of former blog posts (see here , here and here) these rain pulses caused very visible radioactive peaks measured by our Geiger counter. We know that these peaks are essentially caused by a radon washout (the peaks are the fingerprint of the gamma-emitting radon daughters).
We all like nice and clean cause-effect relations, preferentially linear ones. When we look at what happened during the week from the 21 to the 26 July, we see that things are a bit more complicated:
 The upper plot shows in blue the intensities of the precipitation peaks (in mm per 30 minutes, also given by the corresponding labels) and in red the cumulative precipitation. The lower plot gives the dose-rates in nSv/h, with the yellow boxes showing the approximative numbers for clarity. If we assume an usual background about 83 nSv/h, you should subtract 83 from these numbers to yield the peaks caused by the washout.
In the preceding blogs I suggested that after a first washout the atmosphere requires a minimum time to “recover”: a rain pulse, even much more intense, prior to that minimum (3 days were suggested) yields a lower radioactive response. What happened the 22 July 2016 shows both the same and an opposite behavior: the storm rain pulse of 12.9 mm follows less than 24 hours a normal heavy downpour of 4.2mm. This first precipitation event lashes out a radiation peak of 16 nSv/h; the storm event, with a 4 times higher intensity, produces practically the same radiation rise. But even more intriguing is the next rain event some 5 hours later: a meagre 1.8 mm rain produces a radiation peak of 13 nSv/h, not much lower than the preceding one.
So we have in this week two conflicting situations:
a. the first confirms the hypothesis of an atmospheric recovery-time: you can not washout what isn’t yet there; the very heavy storm event happens too early to produce a bigger radiation peak.
b. the small precipitation event following the 19: 00 UTC “monster” causes an important radiation peak, in violation of both the effect-proportional-to-cause and the time-lag hypothesis. I have no explanation to this for the moment. A first enquiry would be looking for a precipitation measurement error. I checked this with our Davis VantagePro II backup station, mounted at a distance of about 4 m. The next table shows the details of the measurements:

The last column corresponds to the increase of the dose-rate, taking 83 nSv/h as the reference.
Clearly, there is a delay of about 1 hour between the precipitation and the radiation peaks. What remains puzzling, is the strong radiation pulse after a very modest rain peak following the “big one”.
Let us finish this short analysis by plotting the radiation increase versus the rain pulse which is its cause. I will add all the data of this week to the values measured in 2013 and 2014. First the table with these data:
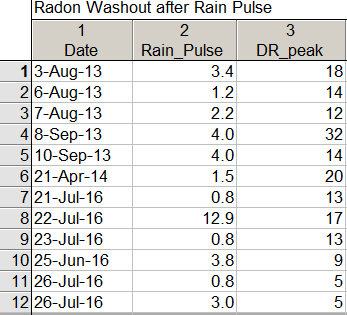
and now the graph:

We see that the big storm from 22-Jul 19:00 is an outlier, and a linear model might not be the best. The Pearson correlation between rain-pulse and radiation-peak is 0.23, statistically not significant at the alpha = 0.95 level. Omitting the outlier betters the correlation to 0.32, but it remains not significant. Now this discussion on significance is moot, as clearly the observations show that radon washout does exist. What remains deeply puzzling is not the situation in cases 11 & 12 (the last two lines of the preceding table): a first small rain pulse might cause a distinct radiation peak, and to get the same peak a second rain pulse following shortly must be much higher.
But the situation in cases 8&9 remains for me disturbing: why does the small rain pulse following the big one create a similar intense radiation peak?
Thank you for an answer, if you have a clue what might happen here….
_____________________________
01-Aug-2016: added as a supplementary information to Marcel’s comment.
The link to the full paper of Livesay “Rain induced background radiation….” is here.

August 1, 2016 at 11:40 |
Hi Francis,
This behaviour is strange indeed. Maybe there is an additional role for 214Pb and 214 Bi as they have different, much shorter half lives compared to 222Ra, and their gamma radiation might be measured too, according to the energy measurement range of the detector. I found this information in the following study: Jake Livesay et al., Rain-Induced Increase in Background Radiation Detected by Radiation Portal Monitors, Journal of Environmental Radioactivity, Volume 137, November 2014, Pages 137-141.
Greetings,
Marcel Severijnen
July 27, 2021 at 14:30 |
[…] radon washout, the ambient gamma radiation shows sometimes impressive peaks ( see here, here, here, here, here, […]