Since “immemorial” times (actually 1997) we measure the thickness of the ozone layer at Diekirch, Luxembourg (we = Francis Massen & Mike Zimmer). Our two instruments are small handheld MICROTOPS II “ozonometer” devices from Solar Light Company.
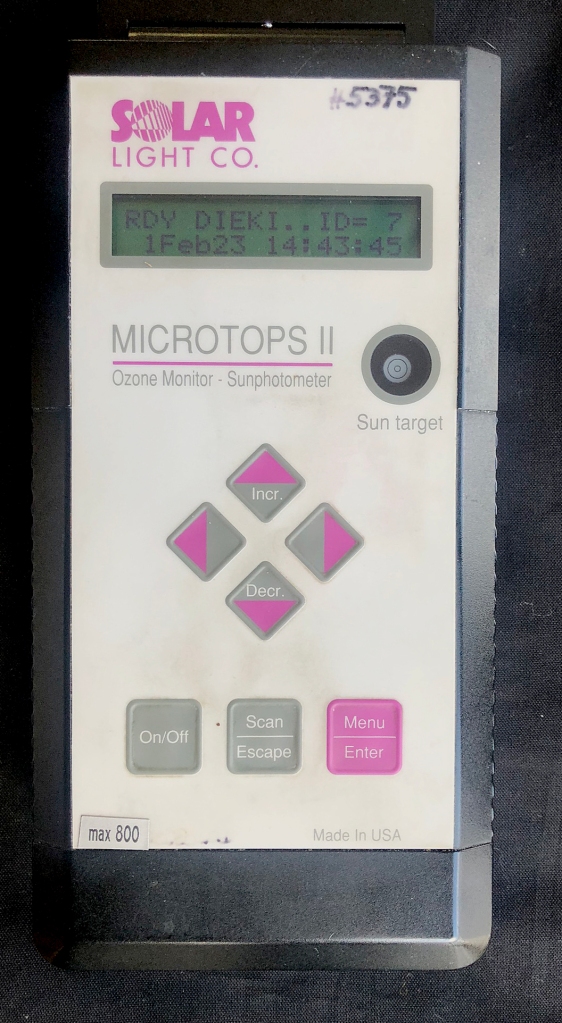
Measurement is done by pointing the instrument to the sun (what is called DS direct sun measurements), and taking several measurements (usually 3 to 5, during one moment of the day, preferentially close to 11-12 UTC time). Each measurement is the average of ca. 45 rapid “firings”. You have to point carefully to get good readings (see here) !
This instrument has been developed many years ago, and is the spin-off of Forest Mims III, an American scientist who didn’t believe NASA’s satellite base ozone measurements were correct, and developed his own el-cheapio instrument, showing that NASA was wrong (he received the Rolex award for this in 1993!). See a bio of this exceptional person here and his website here.

All our “raw” data files are available at https://meteo.lcd.lu/data/. We regularly check our measurements against those made at Uccle (Belgium, close to Brussels), by the RMI (Royal Meteorological Institute). Dr. Hugo de Backer is responsible for the TOC measurements made at Uccle with two very expensive Brewer instruments from Kipp & Zonen:

On top of this, Uccle makes ozone soundings with balloons, and is considered as one of the world reference stations for measuring the thickness of the ozone column. Their data go back to 1972, and are published here:
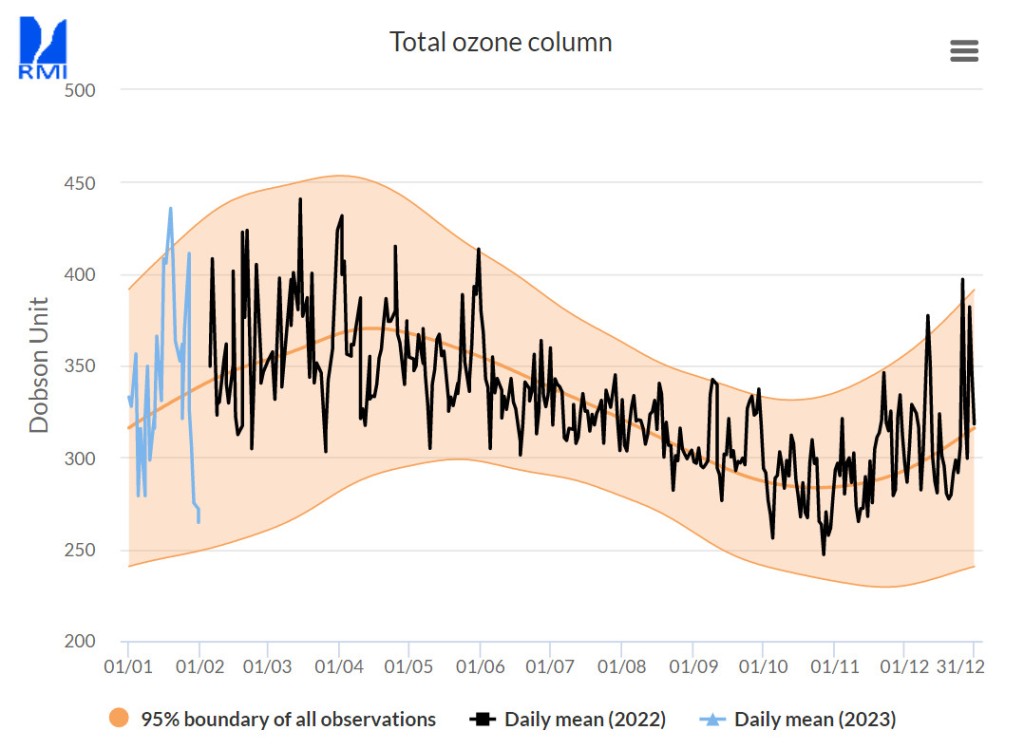
This plot (screenshot 1 Feb 2023) shows how rapidly the TOC changes on a daily basis, but also that there is a clear sinus-pattern during the year, with a maximum in spring and minimum in autumn. The yellow region represents the boundaries of 95% of the observations, and the visible brown curve the average from 1972 on. The blue plot are the readings for 2023, the black those of the last year 2022.
So when comparing our Microtops measurements, the first criteria should be the synchronicity between the observations at Diekirch and at Uccle. Look at the next plot, which shows the 2022 observations made the same day at Uccle and Diekirch (we made measurements for a total of 180 days, Uccle with both Brewer instruments for about 291 days). These correspond to direct sun (DS) measurements, which obviously need the sun to shine! We have days where Uccle is silent, and vice-versa. There remain 164 common days to compare. When available, MK3 readings are used, when not MK2).
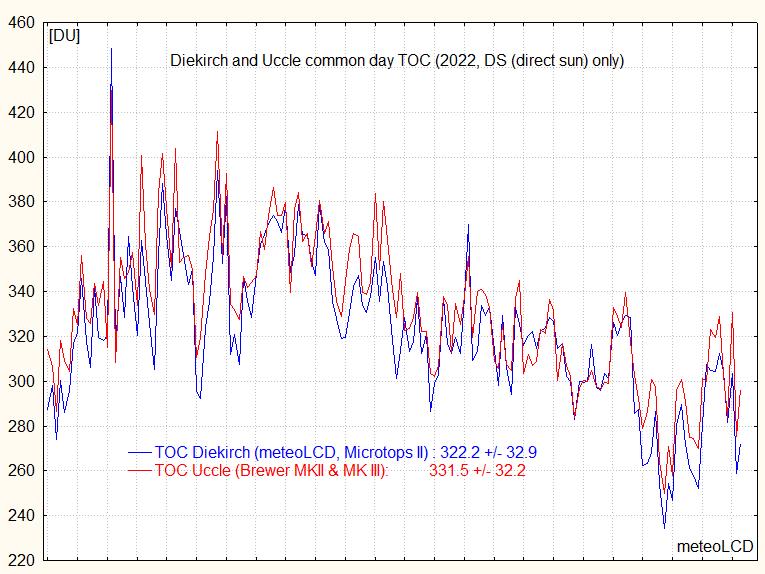
The x-axis is not a regular time-axis, but simply corresponds to measurements from January to December. What is directly visible, is that both instruments clearly are extremely well in sync:peaks and troughs happen simultaneously at Uccle and Diekirch. One also sees that our (blue) curve is practically always lower than the red one, which means that our Microtops readings should be multiplied by a calibration factor (or adjusted for an offset).
Plotting the Uccle data versus the Microtops gives this factor:
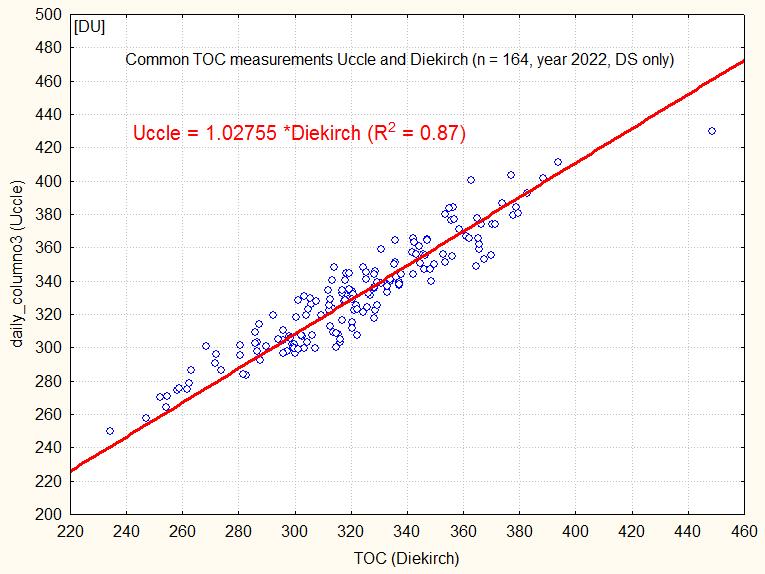
The linear fit shows that the Microtops readings should be multiplied by 1.02755 to calibrate them to the Uccle Brewer instruments; in simpler words, our instrument is ca. 2.6% low compared to the reference Brewers (making no difference between them). This means, that for instance instead of correctly measuring 300 DU, the Microtops reads 292 DU. Now Uccle has two Brewer in operation: an older Mk II and the newer MK III.
Here is what we get if we take only DS measurements from common days and divide MK3 readings by those of the older MK2:
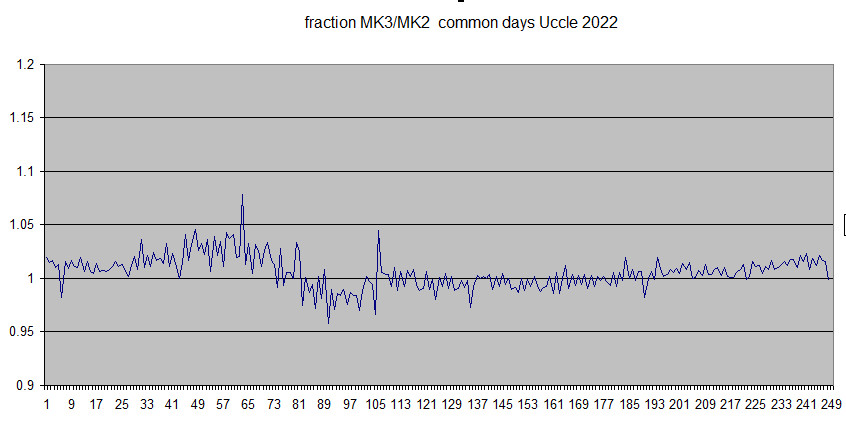
You see that there are peaks crossing the 1.05 fraction, so even these very expensive instruments deviate somehow; the maximum same day difference is 24 DU.
Let us plot MK3 readings versus MK2:
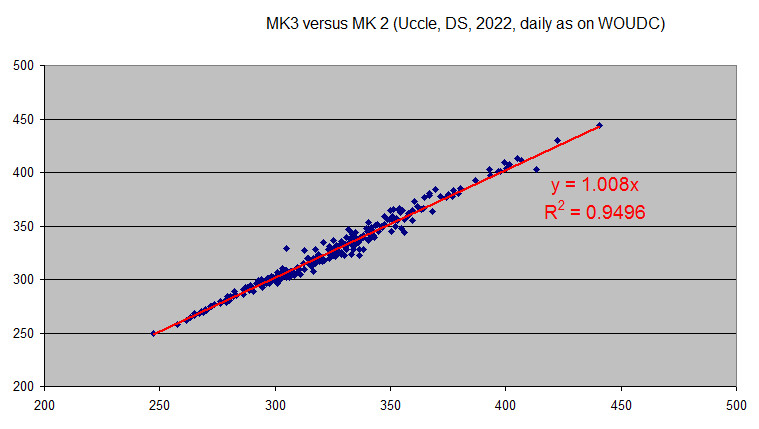
One notes that MK3 deviates by ca. 0.8% from MK2.
So once more we can be satisfied with our TOC measurements. This continuity demands real efforts from both of us, who do all this work on a voluntary non-paid basis. Being the only station in Luxembourg(we are WOUDC station 412) making total ozone column measurements since 1997 i.e. more than 25 years is an endeavor meteoLCD can be proud of.
Previous comparisons can be found in the “Papers” section of the meteo.lcd.lu web-site.
Leave a comment