There is a new paper published in April 2021 in Research in Astronomy and Astrophysics titled “How much has the Sun influenced Northern Hemisphere temperature trends? An ongoing debate” (link). The authors are R. Connolly, W. Soon, M. Connolly together with 19 coauthors. All these people are from well-known universities or research facilities, and as such have impressive scientific backgrounds. The paper is quite long, more than 70 pages including a huge 536 items reference list. I recommend a careful reading of this paper that is the best overview of scientific knowledge regarding the sun-climate question I know of. What makes this paper unique is that it presents many facets of the problems of the TSI variability and of NH surface temperature series. It honestly states that not all coauthors share the same conclusions, so it clearly is not a cherry-picking paper pushing an activist agenda. As this is such a large and diverse paper, I will just touch on a few aspects, and try to give a short summary.
Its main conclusion is that the IPCC’s stand on the influence of the sun on global warming is at least open for discussion, and ignores a huge amount of scientific findings that conflict with its anthropocentric view on human caused climate change.
The problems with knowing TSI
Everybody knows that the sun is the engine that drives Earth’s climate, and that the energy output of this big thermonuclear reactor is not constant. Best known are the 11 years Schwabe cycle of total solar intensity, and the 22 years Hale cycle of its magnetic activity. The TSI (irradiance in W/m2 on a surface perpendicular the the solar rays, measured at TOA, the top of the atmosphere) really is directly and continuously measured only since the satellite times, starting in 1978 with the NIMBUS 7 satellite and its ERB (Earth Radiation Budget) mission. Previous data are more patchy, coming from soundings with balloons and rockets, or from indirect proxies like solar spots, changes of the solar magnetism measured at ground level or even planetary (astronomical) causes.
43 years of satellite measurements covering nearly 7 Schwabe cycles should be enough to yield a definitive answer for TSI variability, but this is alas not the case. The satellites instruments degrade with time, and successive satellites have different biases and measurement problems:

The figure shows that the series differ by about 10 W/m2, so simply stitching together these series is impossible (just to set this number: the increased radiative forcing caused by the higher atmospheric CO2 concentration from 1750 to 2011 is about 1.82 W/m2, according to the IPCC AR5) . Two best-known efforts to get a continuous “homogenized” series are those from the ACRIM (USA) and PMOD (Davos, CH) teams. Both come to different conclusions: according to ACRIM there is a general increase in TSI, whereas PMOD thinks that TSI remains more or less constant. Needless to say that the IPCC adopts the PMOD view that conforms more to its policy of anthropogenic caused climate warming, and ignores ACRIM
If one includes the proxy series, as this paper does, there are 16 different TSI reconstructions that may be valid. So the least that can be said is that an honest scientific broker should exanimate, and not ignore, them all.
High and low variable TSI series
The 11 year cycle is not the only one influencing TSI; there are also many multidecadal/multicentennial/multimillennial cycles which can be found by spectral analysis or by astronomical causes, like the Milankovitch cycles. If these longer cycle variations are considered small w.r. to the Schwabe cycle, the reconstruction is consider “low variability”, in opposition to “high variability”. The authors try to compare both type of reconstructions with the changes in the NH surface temperature, and they find that the latter (high variability) series correspond better with the NH temperature changes since 1850.
What NH temperature series to use?
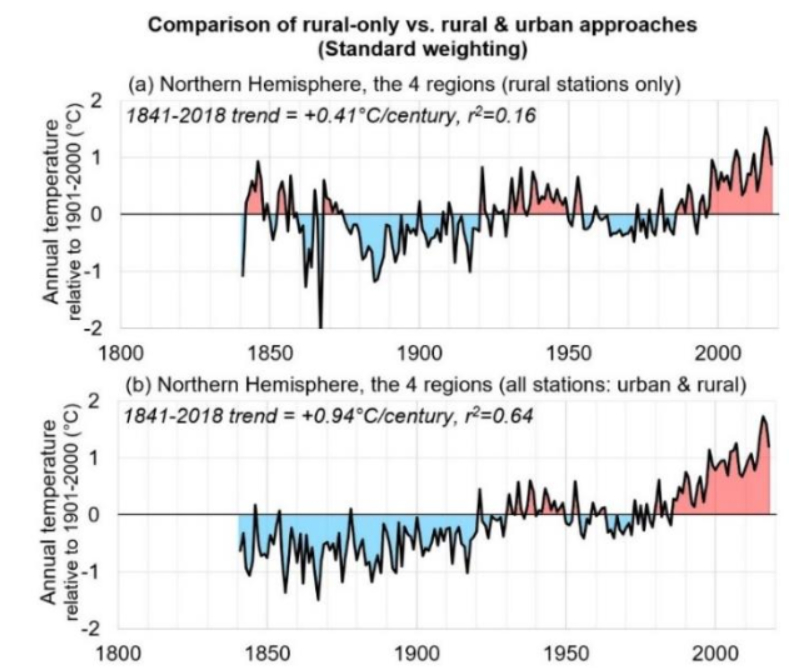
Clearly the vast majority of weather stations are located in the NH. A big problem is that the ongoing urbanization introduces an urban island warming bias, which is still visible in many of the homogenized series like those of NASA-GISS. So the authors propose to use only the stations that were and still are rural since about 1850. The difference can be startling, as shown in the next figure which takes a NH subset of 4 regions (Arctic, Ireland, USA, China):

The warming trend is 0.41 °C/century for the rural only stations, whereas it is more than double with 0.94 °C/century for the combined rual+urban stations. Notice also the much greater variability (i.e. lower r2) of the rural only series!
This makes it clear that the choice of including all stations (with the risk of including an urban warming bias) or only the rural ones (with the handicap of having much fewer stations) will command the outcome of every sun-temperature research.
An example of the solar influence
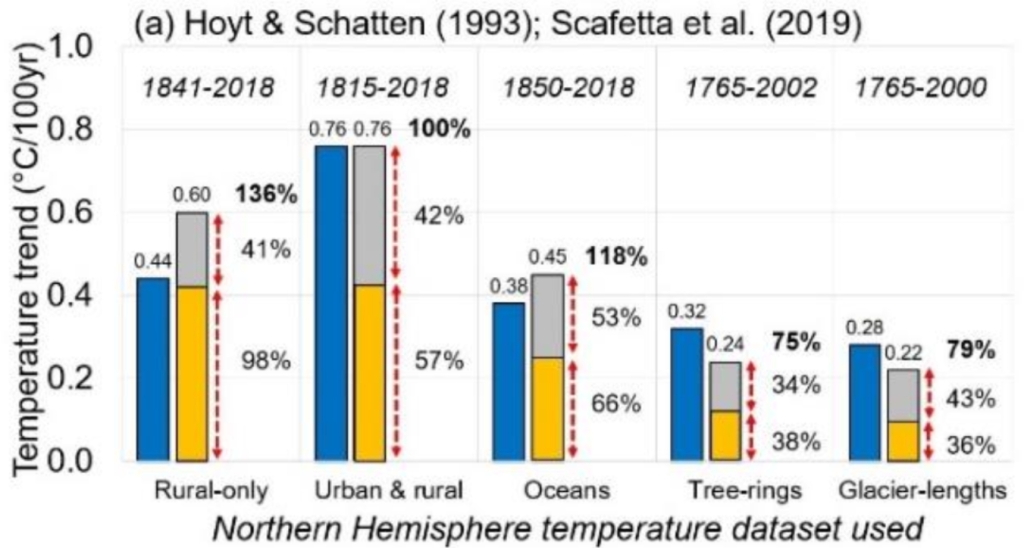
The next figure is a subset of figure 16 of the paper; it shows how the trend of a linear temperature fit (blue box = fit of temperature w.r. to time) can be compared to that of the solar influence (yellow box= fit of temp w.r. to TSI) and the anthropogenic greenhouse gas forcings (grey box = fit of temp. w.r. to GHG forcings); the latter are the residuals left over from the (Temperature, TSI) linear fit.

Using rural only stations, and a high variability TSI reconstruction shows that the solar changes could explain 98% of the secular temperature trend (of the NH surface temperatures); using both urban and rural stations, the solar influence is still 57%, i.e. more than the half of the warming can be explained by a solar cause.
Conclusion
In this short comment I could only glance some points of the paper. It has many more very interesting chapters, for instance on the temperature reconstructions from sea surface temperatures, glacier length, tree rings etc.
What remains is an overall picture of complexity, which is ignored by the IPCC, as well in the AR5 and the new AR6. The science on the influence of solar variability, be it in the visible or UV spectrum, is far from settled. The IPCC ignores datasets that conflict with its predefined political view. The recent warming is only unusual if calculated from the rural + urban data series, but mainly unexceptional if temperature data are restricted to the rural stations.
Leave a comment