
(picture from the PhD thesis of Licciulli, 2018)
When we want to know the temperatures of say the last 1000 years, we must use proxies like changes in the O18 isotope, changes in leaf stomata or tree rings (for instance in the famous bristlecone trees) etc… The best known proxies (beside tree rings) are ice cores, most coming from drilling in Antarctica or Greenland glaciers. Ice cores from European glaciers are few, so the paper by Bohleber et al. on ice cores from the Monta Rosa region is remarkable. The title is “Temperature and mineral dust variability recorded in two low-accumulation Alpine ice cores over the last millenium” (link), and it was published

in the “Climate of the Past” series of the European Geosciences Union (EGU) in January 2018. I became aware of this paper by an excellent comment of Willis Eschenbach in WUWT (24-Jul-2020), I will come back to this later.
What makes the paper of Bohleber so special, is that the location of the 2 ice cores is on the Colle Gnifetti saddle (4450m asl) in the Monte Rosa region (border between Italy and Switzerland), so really in our neighborhood when compared to Antarctica and Greenland. This glacier is not very thick (about 140m only), as the prevailing winds remove a good part of the yearly snowfall. But the ca. 65m deep drillings allow going back by more than 1000 years. The researchers studied the dust layers found in the ice cores, especially the abundance of Ca2+ ions. These dust layers are very thin, so they used quite sophisticated laser technologies to investigate them. They found a good agreement between the observed temperature trends and those of the Ca2+ dust layers (mostly dust from the Sahara: warmer temperatures increase the advection of dust-rich air masses).
The IPCC’s view at the last 1000 years temperatures
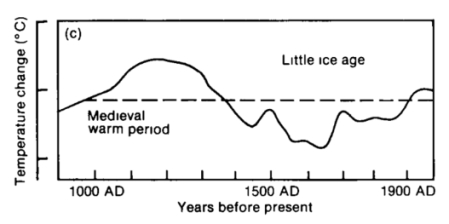
In its first assessment report (FAR) of 1990, the IPCC gave a graph form Hubert Lamb showing (without any clear temperature scale) the existence of a warmer period (MWP) around year 1000 and the later distinctive cooling of the Little Ice Age (LIA):
With the infamous Hockey-Stick paper by Mann in the 3rd report (TAR, 1999) the MWP disappeared, or was ignored (link to original paper):

For political or activist reasons, this faulty graph from a junior PhD became a poster-child in the global warming debate, and remained so for long years, despite the fact that it was shown wrong for an incorrect application of statistical calculations (PCA, principal component analysis) and inadequate choice of tree rings.
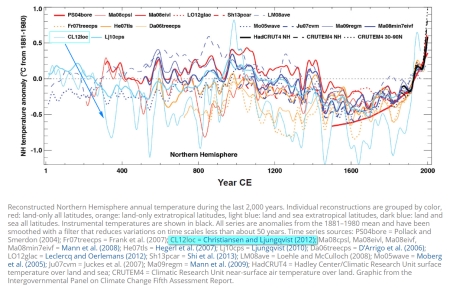
Today there are many reconstructions of the NH temperatures, and the figure below (blue arrow and highlights added by me) shows how different they are, and that at least one (Christiansen and Ljungqvist, 2012) gives hugely changing temperatures, with a very pronounced MWP nearly as warm as today (link):
Now, here follows the reconstruction by Bohleber et al, based as seen above on the study of dust layers, a factor that was not considered in the hockeystick paper.

I have added the text boxes and the arrows to the original graph. First one should note the temperatures are anomalies (=deviations) from the average temperature at GG during 1860 – 2000. The horizontal time axis is reversed, i.e. the most recent period is left, and the “calibration” period is the interval 1860 to 2000. The red curve shows an independent reconstruction by Luterbach of mean European summer temperature anomalies. The black curve gives (if I understand this correctly) these same anomalies as measured by meteorological instruments over Europe (West Europe?).
Willis Eschenbach made a linear regression with the BEST NH temperature reconstructions, and adjusted the Ca2+ curve using this function (y = 1.6*x – 0.2). The visual correlation for the last 250 years is excellent (except a divergence for the last ~25 years):
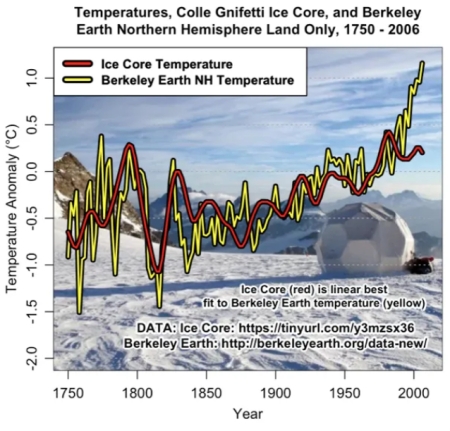
Applying the same regression on the whole CG data, and smoothing by a 15 year filter makes the important details still more visible:

We clearly see two warm periods: one around 850 AD and the other corresponding the the MWP, today called MCA = Medieval Climate Anomaly, because it seems inconvenient to the “consensus climatology” that some CO2 low medieval times were nearly as warm as today. So Bohleber et al. write in their conclusion “the reconstruction reproduces the overall features of the LIA … and reveal an exceptional medieval period around AD 1100-1200”.
What also clearly can be seen in all these graphs is that the climate never was stable for very long times: the normal situation is a changing climate!

Leave a comment