
Many media write in ecstasy that this new report warns that the CO2 mitigation schemes of most countries do not allow to keep global warming below 2°C in 2100! Actually the main point of the report is that if all countries do not reduce their GHG emissions by 40-70% below their 2010 levels and by at least 100% by 2100, this 2°C target will be missed. In this blog I will not muse on the absurdity of this 2°C level, which is a nearly complete guesswork derived from non-verified climate models. I just will take some items relating to Luxembourg, and will shows that this glossy report gives numbers concerning Luxembourg that are close to swindle.
1. Carbon intensity of electricity generation
Page 79 contains a graph showing the carbon intensity in g CO2 per kWh electricity produced for many countries: here Luxembourg’s CO2 intensity goes through the roof:

The figure tells that Luxembourg produced its electricity in 1990 using 2552 g CO2 per kWh, which would have been a cosmic record! In 1990, Luxembourg consumed about 1250 GWh (here), about which 1000 GWh from coal. In 2013, the fraction between total thermal electricity consumption and in-country thermal production is 2.7. This suggest an indigenous Luxembourg thermal production of 1000/2.7 = 360 GWh. There is absolutely no reason which would explain the abyssal low efficiency of Luxembourg’s own power plants to produce this tiny amount of electricity. This statistic is clearly nonsensical, and it is very telling about the care the authors took in checking their numbers.
The recent data are fully available at the web site of the ILR (Institut Luxembougeois de Régulation). I use the data for 2013 which can be summarized as follows:
Global electricity production = 1838 GWh
Production of thermal origin = 1575 GWh
Included in this category is the production of co-generation (“Blockheizkraftwerke”), of burning wood, bio-gas, landfill gas and the production of the TwinErg combined gas-turbine plant.
The balance of 263 GWh comes from wind, solar and hydro production.
Now let us assume that the thermal generation produces 500 g CO2 per GWh, which is about the average for natural gas electricity power plants; notice that we include all bio-gas and wood burners here, where at least the last could be considered carbon neutral.
The 1575 GWh correspond to 7,88*10^11 g CO2 emitted in 2013 . Dividing this number by 1838*10^6 gives us a (maximum!) CO2 intensity of 429 g/KWh, well in line with the grey bar showing about 350 g/kWh.
The graph should have omitted the 1990 bar for Luxembourg; that it found its way into the figure shows that these graphs are milked from databases without any intelligent thinking.
2. Emissions per sector
At page 21 we find this figure:
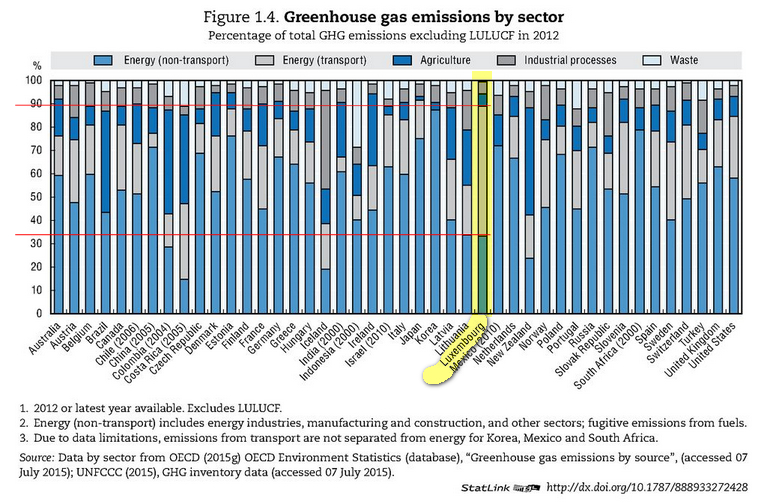
Look at the distance between the two red lines: Luxembourg’s emissions from transport are close to 55% of the total! This is a world maximum! Do the Luxembourg people drive like crazy 24 hours a day on their 2967 total length of roads (including 147 km motorways)? Or do they drive gas guzzlers that use x*100 liter/100km ? Definitively no; the authors of the OECD report forgot to mention that close to 80% of all fuel sold at Luxembourg’s pump stations goes into foreign cars, and so does not stay in Luxembourg and can not be taken as an internal Luxembourg consumption. The real part of the transport sector emissions inside Luxembourg is closer to 55*0.2 =11%, similar to what can be found in Germany or Belgium. All statistics ignoring this basic fact are swindle, as are the monstrous 20.9 tons CO2 per capita emissions for Luxembourg computed by using wrong numbers and found in many databases (see here). A calculation method that is ok for large countries where fuel export is a tiny part of the total volume sold at the pumps can and must not be used for small countries where the major part of the pumped fuel goes into foreign car tanks.
3. CO2 efficiency
Now lets conclude with a more positive remark. The figure 1.2. shows the trend in GHG emissions versus GDP:
 During the 23 years interval 1990 – 2012, Luxembourg’s efficiency increases dramatically. The GHG emissions per unit of GDP fall by close to 60%, bettering Germany and most other European countries. Alas, that the Russian Federation is the champion on this graph makes me think twice, damping the good patriotic vibrations.
4. Conclusion
This OECD report makes for a pleasant reading, but leaves with the impression of a quick copy/paste from various databases and a disturbing absence of critical thinking. The IPCC gospel is taken as a divine truth, and finally the laments reported in the media are not much more than the result of a primitive extrapolation of current CO2 emissions. One more of these sloppy reports that beat the drums waiting for COP21 !
_________________________________
03 Nov 2015:
just as another illustration how Luxembourg is seen on UNEP statistics (graph from UNEP): The red arrow point to Luxembourg, the size of the disk is proportional to the total CO2 emisions:


Leave a comment